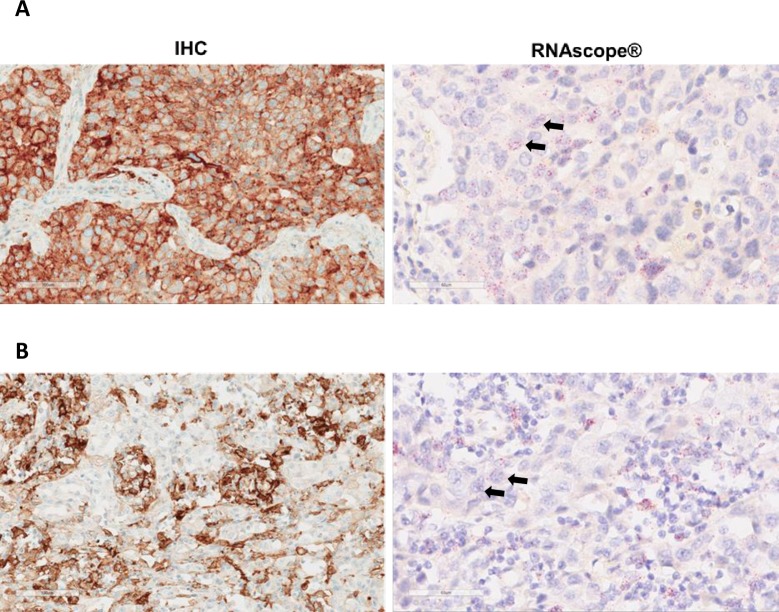
Fig 1. Representative images of 2 NSCLC cases demonstrating varying degrees of %TCmRNA and TCIHC staining.
A. Case shows 100% TC IHC staining, 66% TC mRNA staining and 2–3 dots/tumour cell. B. Case shows 70% TC IHC staining, 48% TC mRNA staining and 1–2 dots/tumour cell. Arrows indicate examples of cell nuclei with RNAScope staining.

