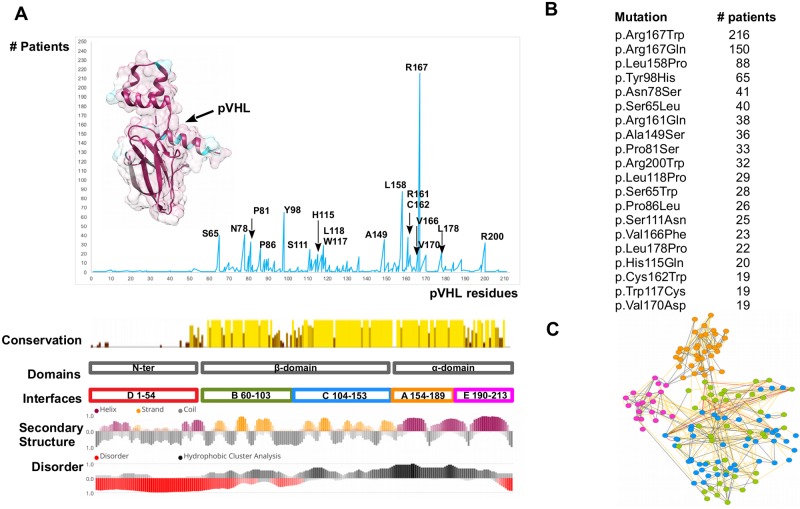
Fig 1. The most frequently mutated pVHL positions.
(A) pVHL mutations are grouped and collected based on their occurrence among VHL patients. The pVHL 3D structure is presented as cartoon and colored by sequence conservation. Interfaces definition, secondary structure and disorder content are presented below. (B) The most frequent pVHL mutations. (C) RING representation of pVHL residues interaction network, colored by secondary structure. Edges represent connection among residues (nodes), with red representing π-π stack interaction, blue salt bridges while yellow and grey for van der Waals and hydrogen bonds respectively.

