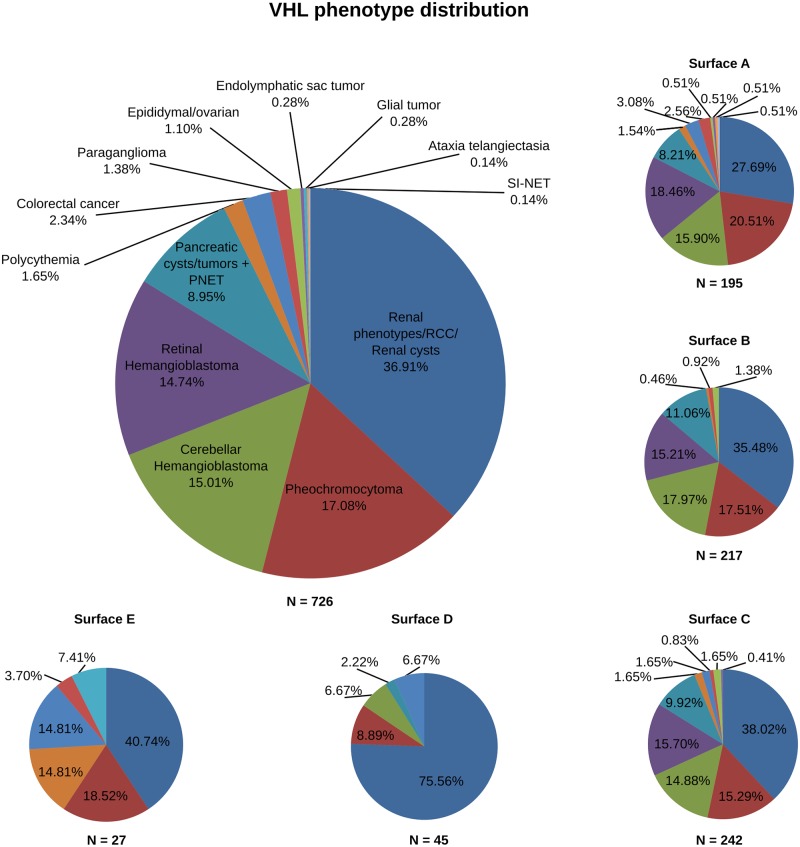
Fig 4. Distribution analysis of pVHL mutations and related phenotypes.
The large circle shows the percentage of mutations for which a specific phenotype is reported from patients. The same distribution is reported for each pVHL surface (small circles). HB = hemangioblastoma; PNET = pancreatic neuroendocrine tumor; RCC = renal cell carcinoma; SI-NET = small intestine neuroendocrine tumor.

