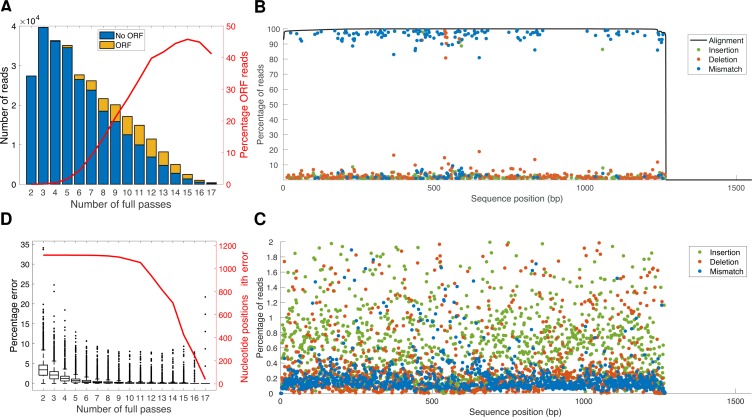
Fig 2.
Analysis of Pacbio sequence data: (A) Number of reads aligning to VSGs per number of full passes, with proportion of those reads comprising predicted ORF in yellow; red line shows percentage of reads at each threshold of full pass number that contained a predicted VSG ORF. (B) Percentage of reads at each position in the N-Terminal domain that contained a mutation with respect to the reference genome sequence for VSG Tb08.27P2.380; alignment coverage is shown by the black line, insertions by green dot, deletions by red dot and mismatch by blue dot. (C) Focused representation of data in 2B, with only mutations with respect to the genome reference sequence <2% at each position in the N-Terminal domain VSG Tb08.27P2.380 shown; insertions shown by green dot, deletions by red dot and mismatch by blue dot. (D) Percentage error rate plotted against number of full passes; red line indicates number of nucleotide positions for those aligning to VSG Tb08.27P2.380 that contained an error with respect to genome reference sequence against number of full passes.

