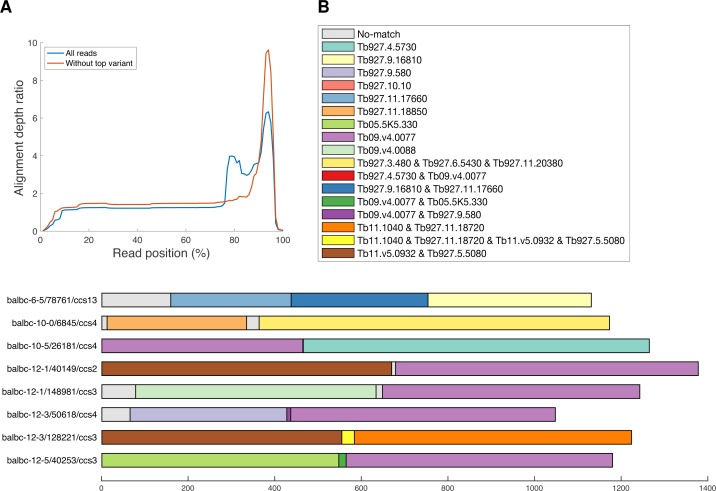
Fig 5. Mosaic gene identification.
(A) Average number of donor VSGs (y-axis) per position across scaled VSG reads (gene length scaled to 100 (x-axis); data derived from 296,937 VSG amplicons)–blue line shows data for all reads, red line shows data for all data without reads that map to Tb08.27P2.380. (B) Example mosaic gene candidates, represented by read identifier, and displayed to scale from 5’ to 3’ (N-terminal domain only), with colour of each segment indicating most likely donor VSG from the TREU927 VSG repertoire (VSG gene shown in key; where relevant sequences are identical for more than one potential reference gene donor; all possibilities are shown in key).

