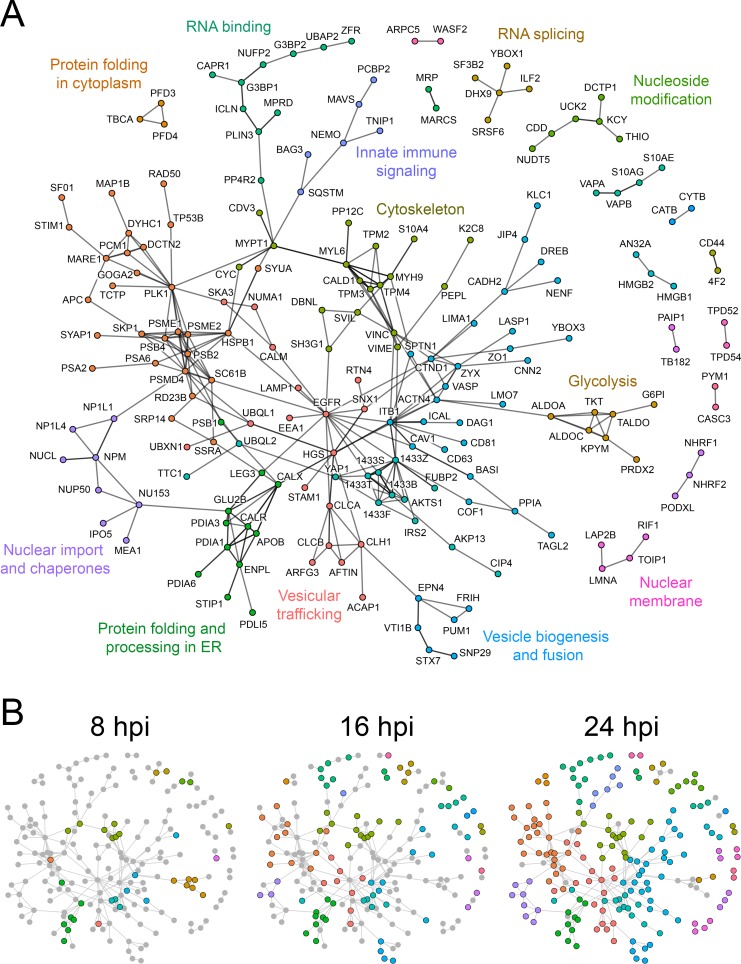
Fig 3. Network analysis of C. trachomatis inclusion membrane interacting proteins.
(A) Interactions between host proteins identified by APEX2 proteomic labeling were obtained from StringDB [89], and visualization map was generated using R with the tidygraph package [86]. Colors represent more interconnected protein communities within the network. The interaction map in A represents the global extent of inclusion membrane interactions identified over the chlamydial developmental cycle. Edges between protein nodes represent interactions that were curated in StringDB either from published experiments or other databases. Proteins which do not have characterized interaction partners (i.e. single nodes) and translation related proteins were omitted for clarity. (B) Temporal dynamics of inclusion membrane protein interaction networks over the developmental cycle. Protein networks present in 8, 16, and 24 hpi proteomic data sets are represented by colored nodes. Gray nodes depict proteins present in the global interaction map (A) but absent from a specific stage of infection.

