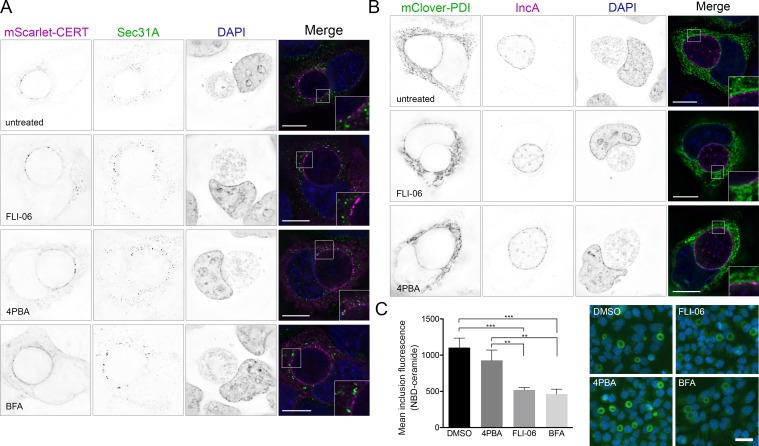
Fig 8. Membrane contact sites and ceramide uptake are maintained during inhibition of ERES.
Cells were infected with C. trachomatis, then transfected with a plasmid expressing pmScarlet-CERT (A, purple in merge) or pmClover3-PDI (B, green in merge). At 20 hpi, DMSO, 10 μM FLI-06, 5 mM 4PBA, or 3 μg/mL BFA were added to cells. At 24 hpi, cells were fixed and stained with anti-Sec31A (A, green in merge) or anti-IncA (B, purple in merge). DNA was stained with DAPI (blue in merge). Images are single planes from deconvolved z-series. Scale = 16 μm. (B) Inset shows regions along the inclusion membrane where PDI was closely apposed or overlapping IncA. (C) Average inclusion fluorescence after incubation with NBD-C6-Ceramide. Representative images shown on right, NBD-ceramide in green, DAPI in blue. Significance determined by one-way ANOVA with Tukey’s multiple comparison test. Any comparisons not shown were not significant. **, p < 0.01; ***, p < 0.001.

