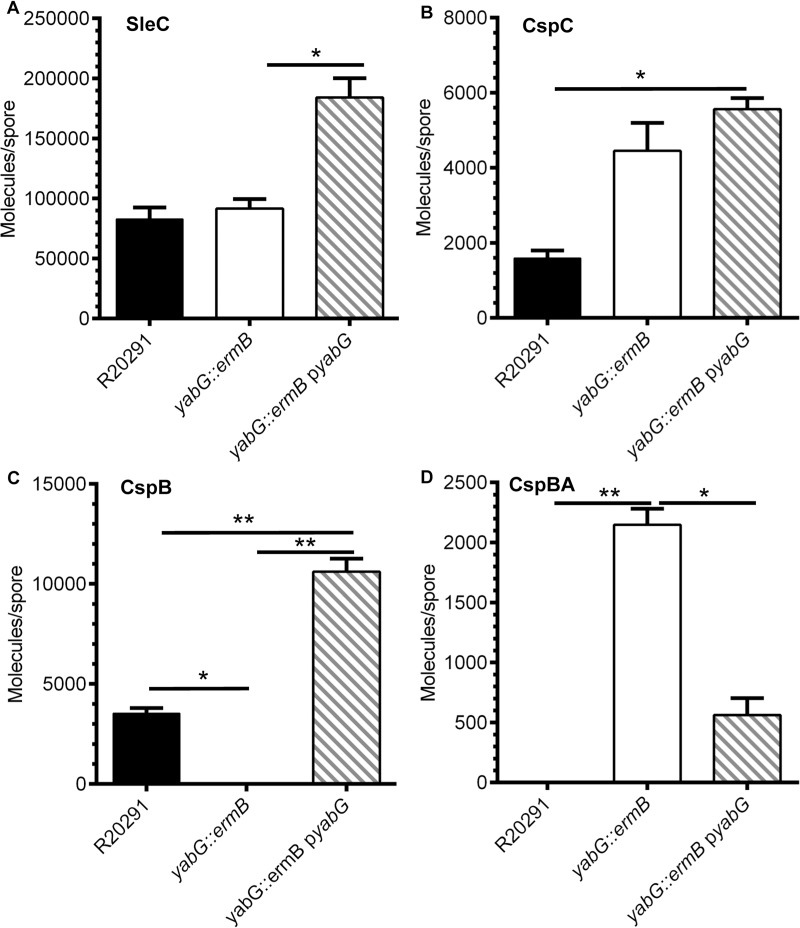
Fig 3. Quantifying the abundance of CspB, CspC and SleC in C. difficile spores.
2 x 10⁹ spores purified from C. difficile R20291, the yabG mutant and complemented strains were extracted with NuPAGE buffer. Samples were separated by SDS-PAGE, transferred to low fluorescence PVDF membranes and blotted with antisera specific to the indicated proteins. The primary antibody was detected with a fluorescently conjugated secondary antibody and quantified as described in materials and methods. Quantified proteins are expressed as molecules / spore and are represented in a bar graph form. (A) SleC, (B) CspC, (C) CspB and (D) CspBA. The data presented represent the averages from three independent experiments and error bars represent the standard error of the mean. Statistical significance was determined using a 1 way ANOVA with Tukey’s multiple comparisons test (* p < 0.05; ** p < 0.01). yabG::ermB only incorporates the preproSleC form.

