29.

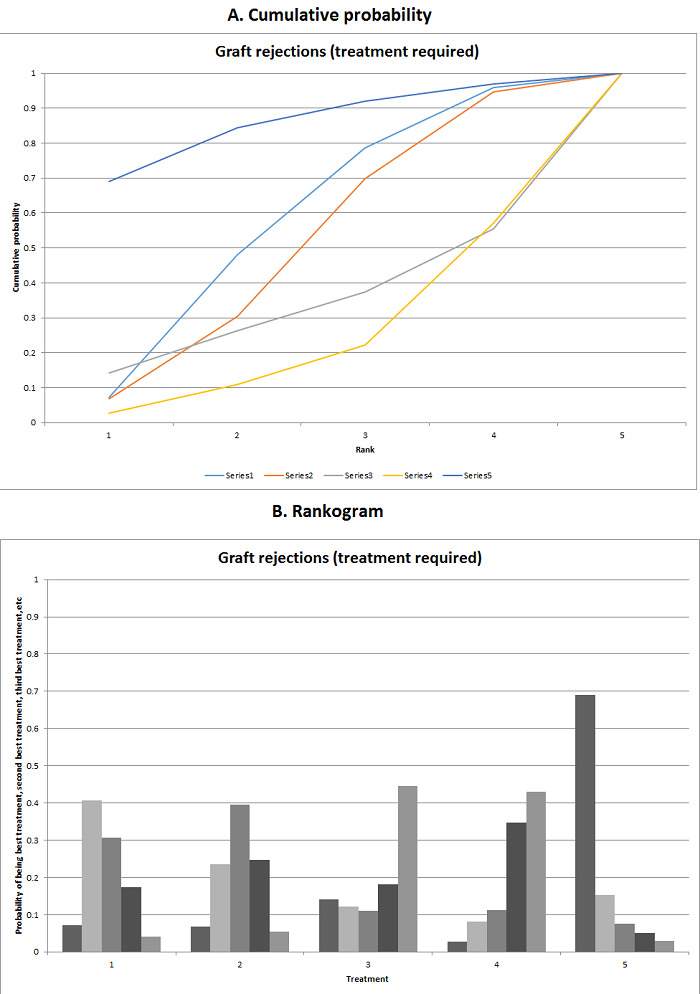
Graft rejections requiring treatment
A. The figure shows the surface area under the curve constructed on the basis of the ranking probabilities. B. The figure shows the probability of each Intervention being best, second best, third best, and so on. There was no evidence that one intervention is clearly better than any of the other interventions. Legend: 1: tacrolimus; 2: cyclosporine A; 3: cyclosporine A plus glucocorticosteroids; 4: everolimus; 5: tacrolimus plus everolimus.
