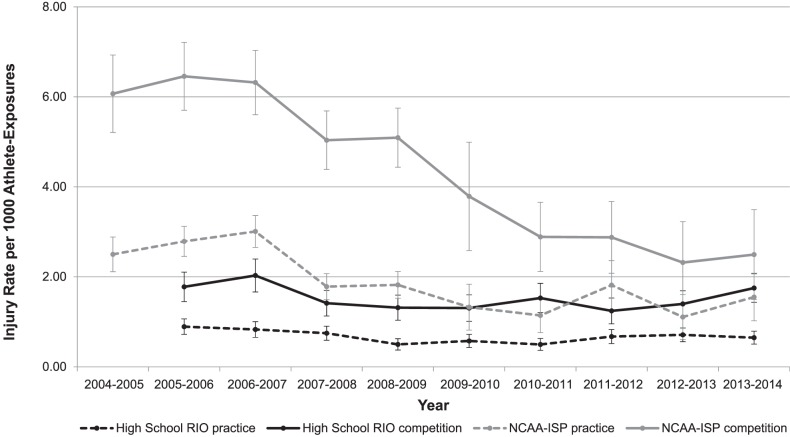
Figure.
Injury rates by year and type of athlete-exposure (AE) in high school boys' and collegiate men's baseball. Annual average changes for linear trend test for injury rates are as follows: High School Reporting Information Online (RIO; practices = –0.02/1000 AEs, 95% confidence interval (CI) = –0.05, 0.01; competitions = –0.04/1000 AEs, 95% CI = –0.09, 0.02); National Collegiate Athletic Association Injury Surveillance Program (NCAA-ISP) 2004–2005 through 2008–2009 (practices = –0.24/1000 AEs, 95% CI = –0.47, –0.01; competitions = –0.34/1000 AEs, 95% CI = –0.57, –0.10); NCAA-ISP 2009–2010 through 2013–2014 academic years (practices = 0.04/1000 AEs, 95% CI = –0.12, 0.20; competitions = –0.32/1000 AEs, 95% CI = –0.47, –0.17). A negative rate indicates a decrease in the annual average change between years, and a positive rate indicates an increase in the annual average change. Any 95% CIs that include 0.00 are not significant.

