2.

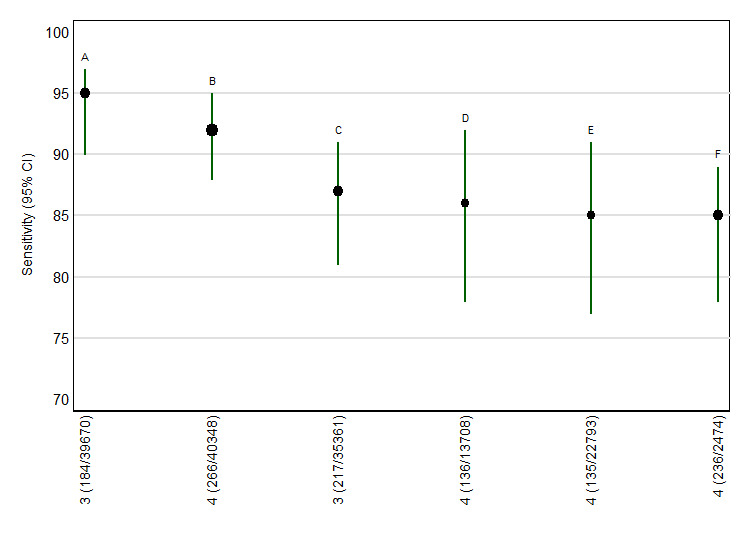
Detection rates (% sensitivity) at a 5% false positive rate for the six most evaluated test strategies (estimates from summary ROC curves).
A = First trimester NT and PAPP‐A , second trimester total hCG, uE3, AFP and inhibin A;B = First trimester NT and PAPP‐A , second trimester free ßhCG, uE3, AFP and inhibin A; C = First trimester PAPP‐A , second trimester total hCG, uE3, AFP and inhibin A; D = First trimester NT, second trimester total hCG, uE3 and AFP; E = First trimester NT, second trimester total hCG and AFP; and F = First trimester PAPP‐A , second trimester total hCG, uE3 and AFP.
All test combinations include maternal age. Each circle represents the summary sensitivity for a test strategy at a 5% false positive rate. The size of each circle is proportional to the number of Down's cases. The estimates are shown with 95% confidence intervals. The test strategies are ordered on the plot according to decreasing detection rate. The number of studies, cases and women included for each test strategy are shown on the horizontal axis.
