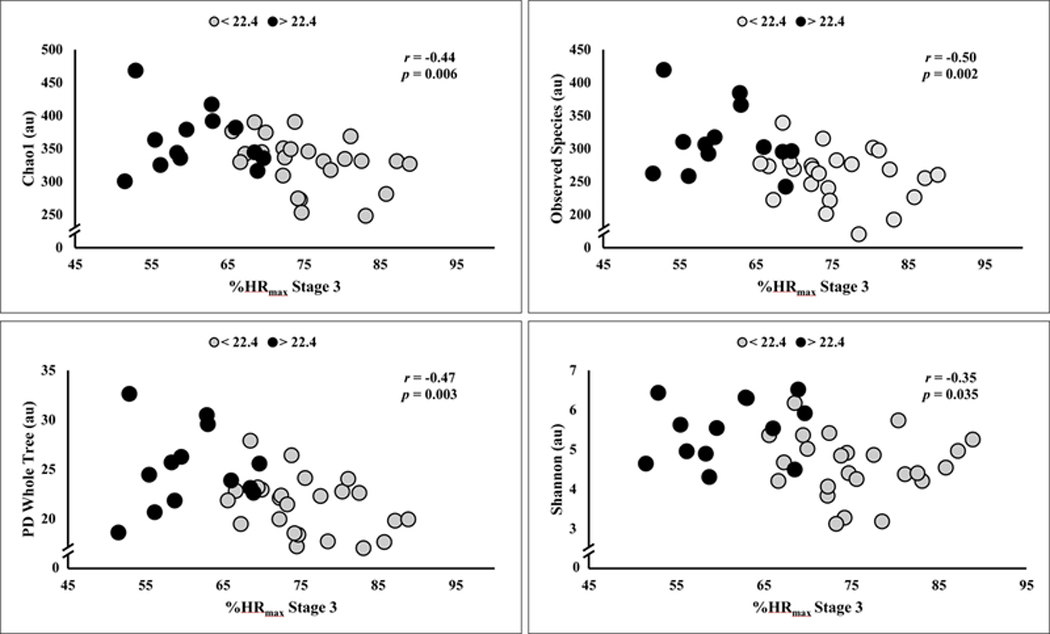
Figure 2:

Unadjusted scatterplot of alpha diversity (e.g., Chao1, Observed Species, PD Whole Tree, and Shannon) and percent of age-predicted maximal heart rate (%HRmax) during Stage 3 of the graded exercise test. Mean intensity corresponded to 70 +/− 10% %HRmax. Note the tendency for greater aerobic fitness, evidenced by lower %HRmax associated with higher alpha diversity. Groups are dichotomized by VO2peak above and below 22.4 mLO2·kg−1·min-1. n = 37.
