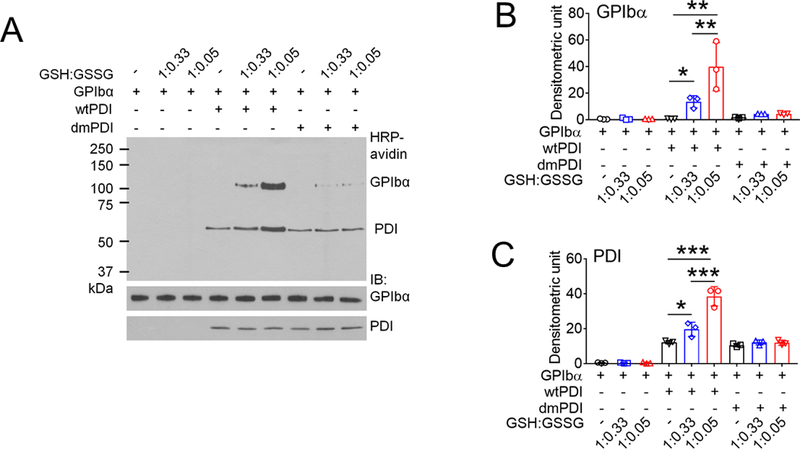
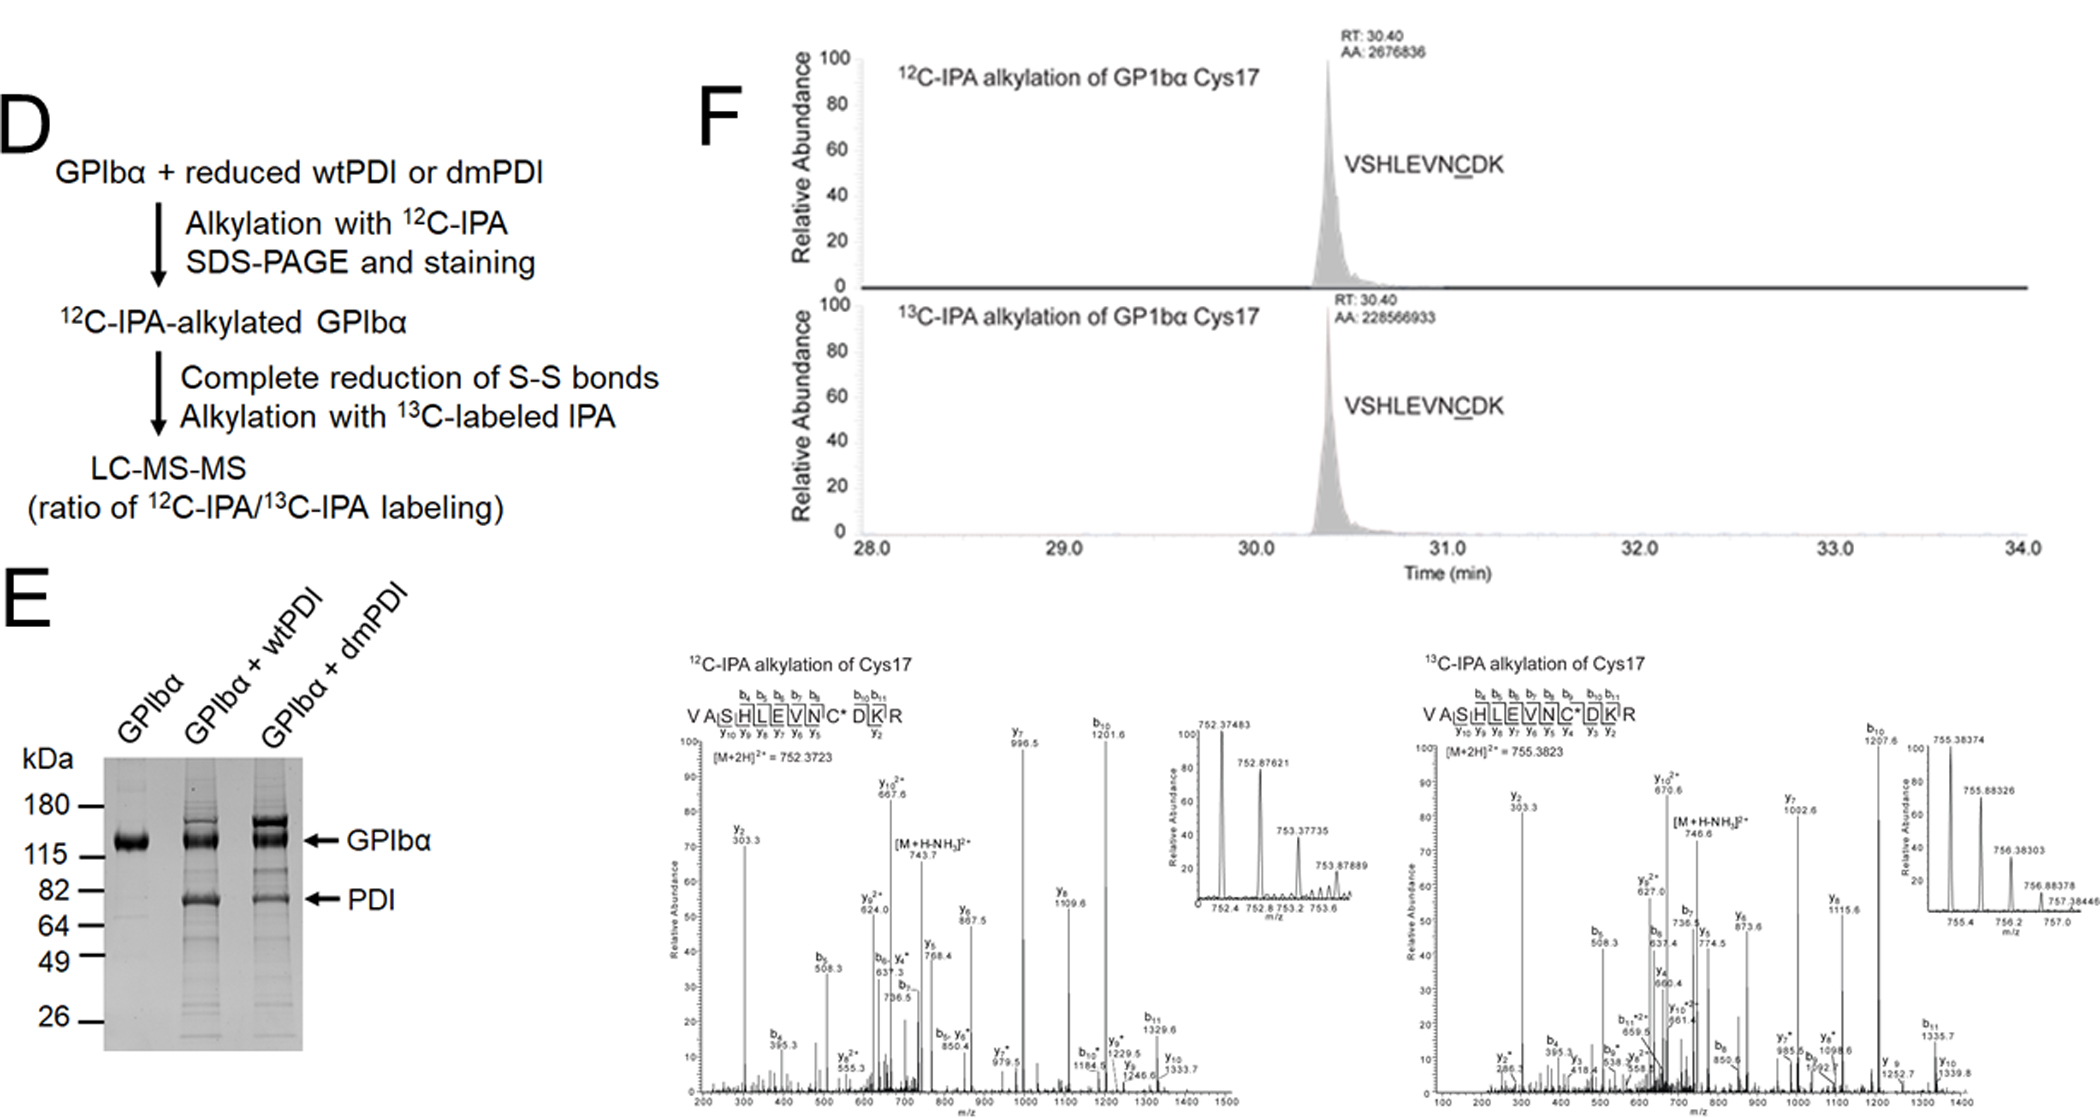
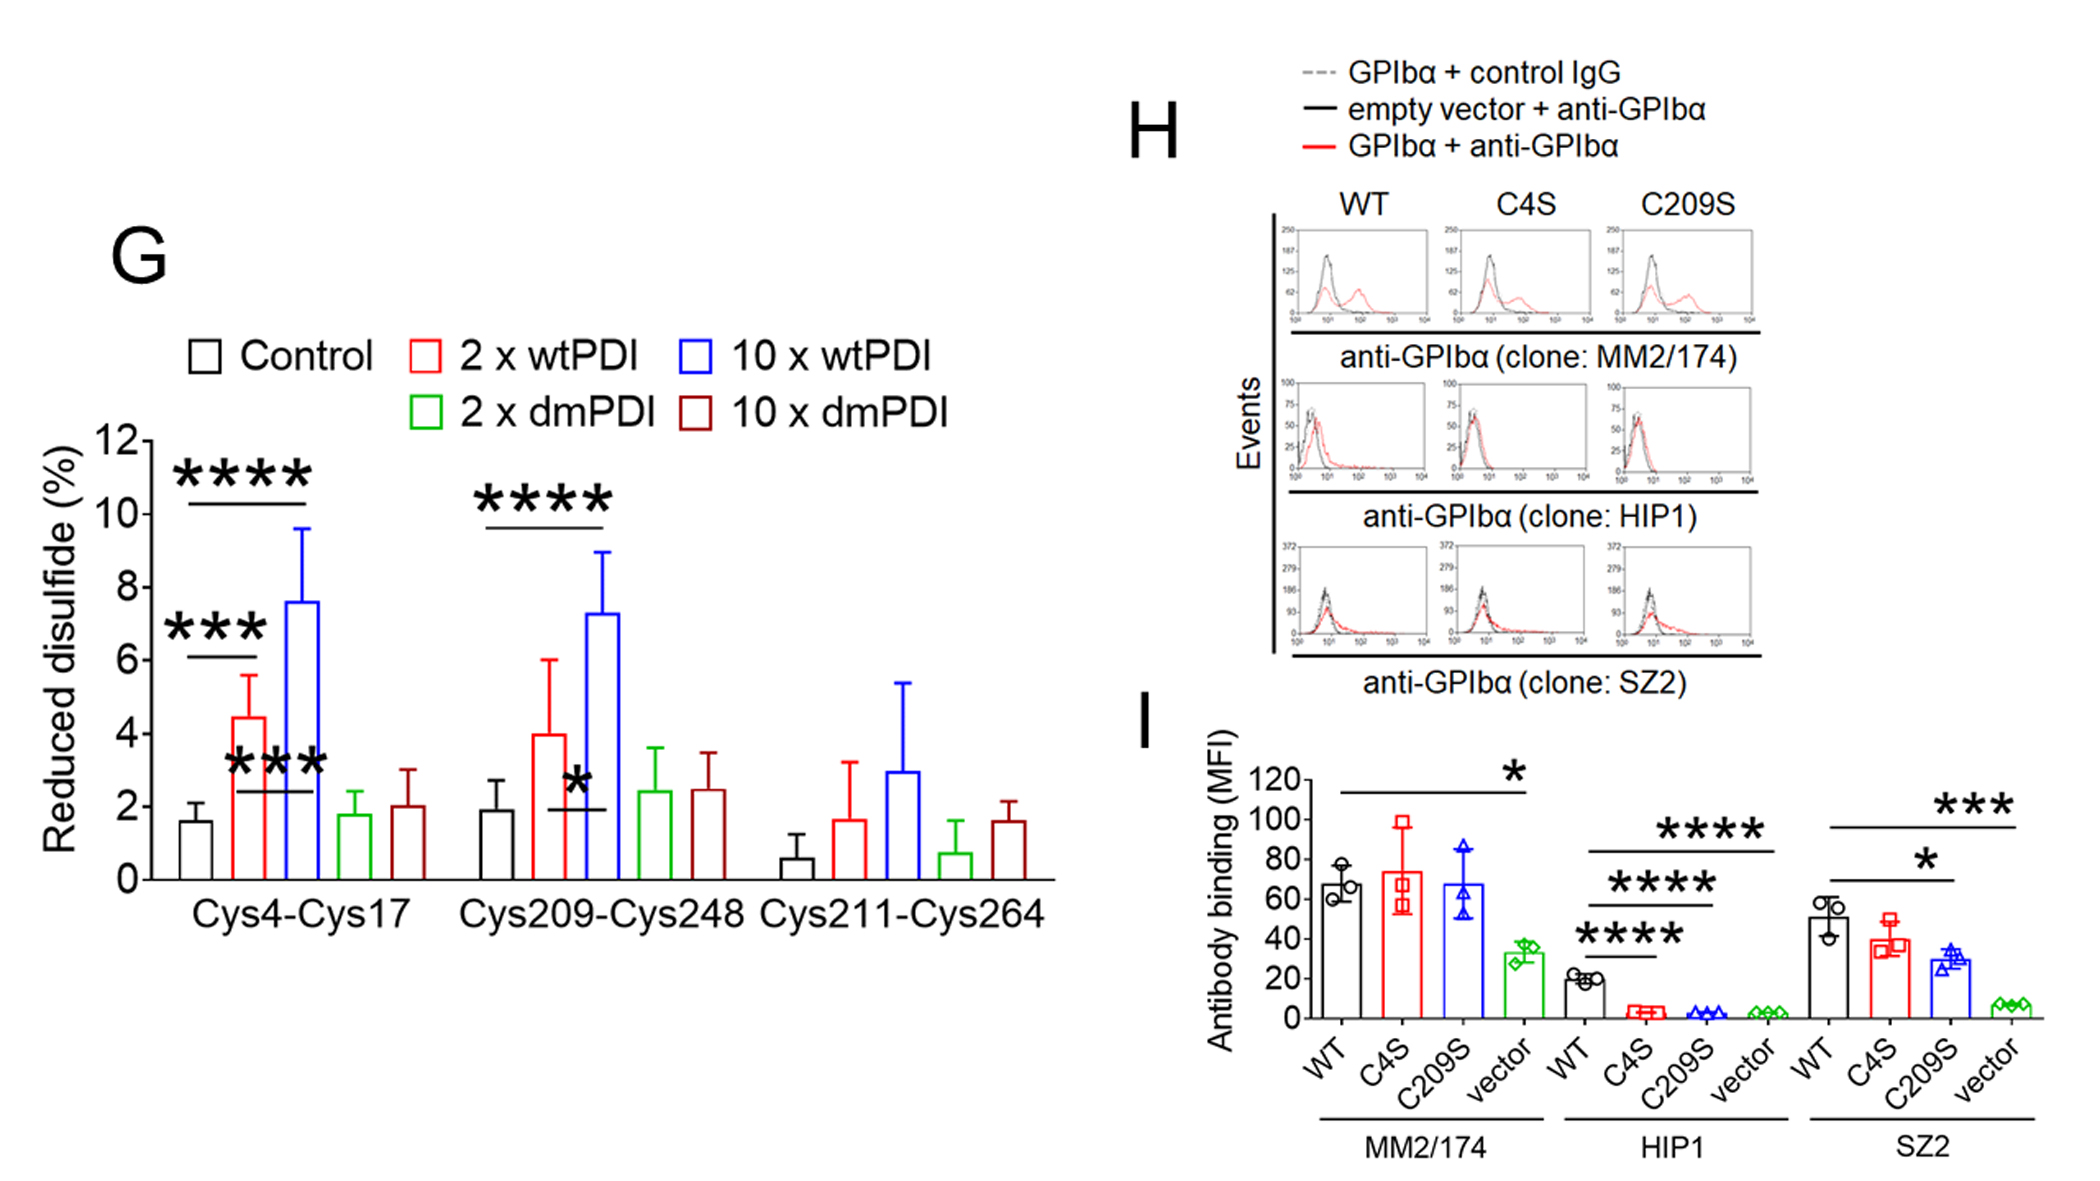
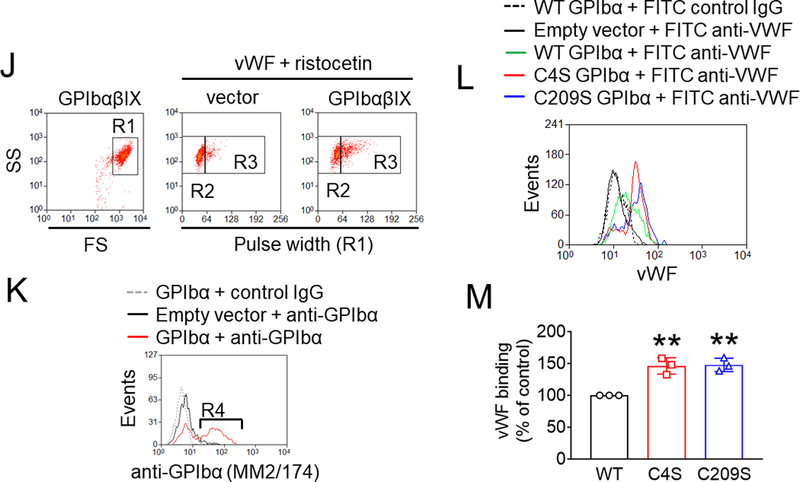
Figure 3. PDI reduces the allosteric disulfide bonds in GPIbα, enhancing the ligand-binding function.


(A-C) GPIbα (50 nM) and either wtPDI or dmPDI (100 nM) were incubated with MPB under different redox conditions (GSH:GSSG = 0:0, 1:0.33, or 1:0.05 mM). Proteins were electrophoresed under reduced conditions and blotted with peroxidase-conjugated avidin (upper panel) or antibodies against GPIbα or PDI (lower panel). Representative blot and quantitated graphs of densitometry (mean ± SD, n = 3). (D) A schematic of mass spectrometric analysis (see Methods). (E-H) Recombinant GPIbα extracellular domain (1.8 µM) was incubated with or without reduced wtPDI or dmPDI (3.6 or 18 μM), followed by incubation with 12C-IPA. (E) Proteins were separated on SDS-PAGE and stained with Sypro Ruby. The band of GPIbα was excised, reduced with 100 mM dithiothreitol, and alkylated with 13C-IPA. (F) HPLC resolution of the GPIbα VASHLEVNCDKR peptide containing Cys17 (underlined) labelled with 12C-IPA or 13C-IPA (top panel). Representative tandem mass spectra of VASHLEVNCDKR peptide with Cys17 (indicated with an asterisk) labelled with 12C-IPA or 13C-IPA. The accurate mass spectrum of the peptide is shown in the inset (observed [M+2H]2+ = 752.3748 m/z and expected [M+2H]2+ = 752.3723 m/z; observed [M+2H]2+ = 755.3837m/z and expected [M+2H]2+ = 755.3823 m/z). Ions with a loss of water are labeled with an asterisk. (G) Redox state of the GPIbα Cys4-Cys17, Cys209-Cys248 and Cys211-Cys264 disulfide bonds in the absence or presence of 2- or 10-fold molar excess of wtPDI or dmPDI. Data represent the mean ± SD of the analysis of 3–9 Cys-containing peptides from 2 different GPIbα preparations. (H-I) CHO cells expressing WT or mutant GPIbαβ/IX or GPIbβ/IX (with an empty vector for GPIbα) were incubated with anti-GPIbα antibodies (MM2/174, HIP1, or SZ2), followed by flow cytometry. (J-M) The CHO cells were incubated with 35 μg/ml vWF and 2 mg/ml ristocetin under a stirring condition (1,000 rpm) for 10 minutes. After washing, cells were treated with isotype control IgG or anti-GPIbα antibodies (MM2/174) and then with Alexa Fluor 647-conjugated anti-mouse IgG antibodies. Cells were incubated with FITC-conjugated control IgG or anti-vWF antibodies, followed by flow cytometry. R1, CHO cells; R2, single cell population; and R3, cell aggregates. (K) The surface level of GPIbα in CHO cells. (L-M) Histograms of cell surface-bound vWF and the quantitative graph. Data represent the mean ± SD (n = 3). *P < 0.05, **P < 0.01, ***P < 0.001 or ****P < 0.0001 after ANOVA and Tukey’s test (B-C, G, and M) or Dunnett’s test (I).
