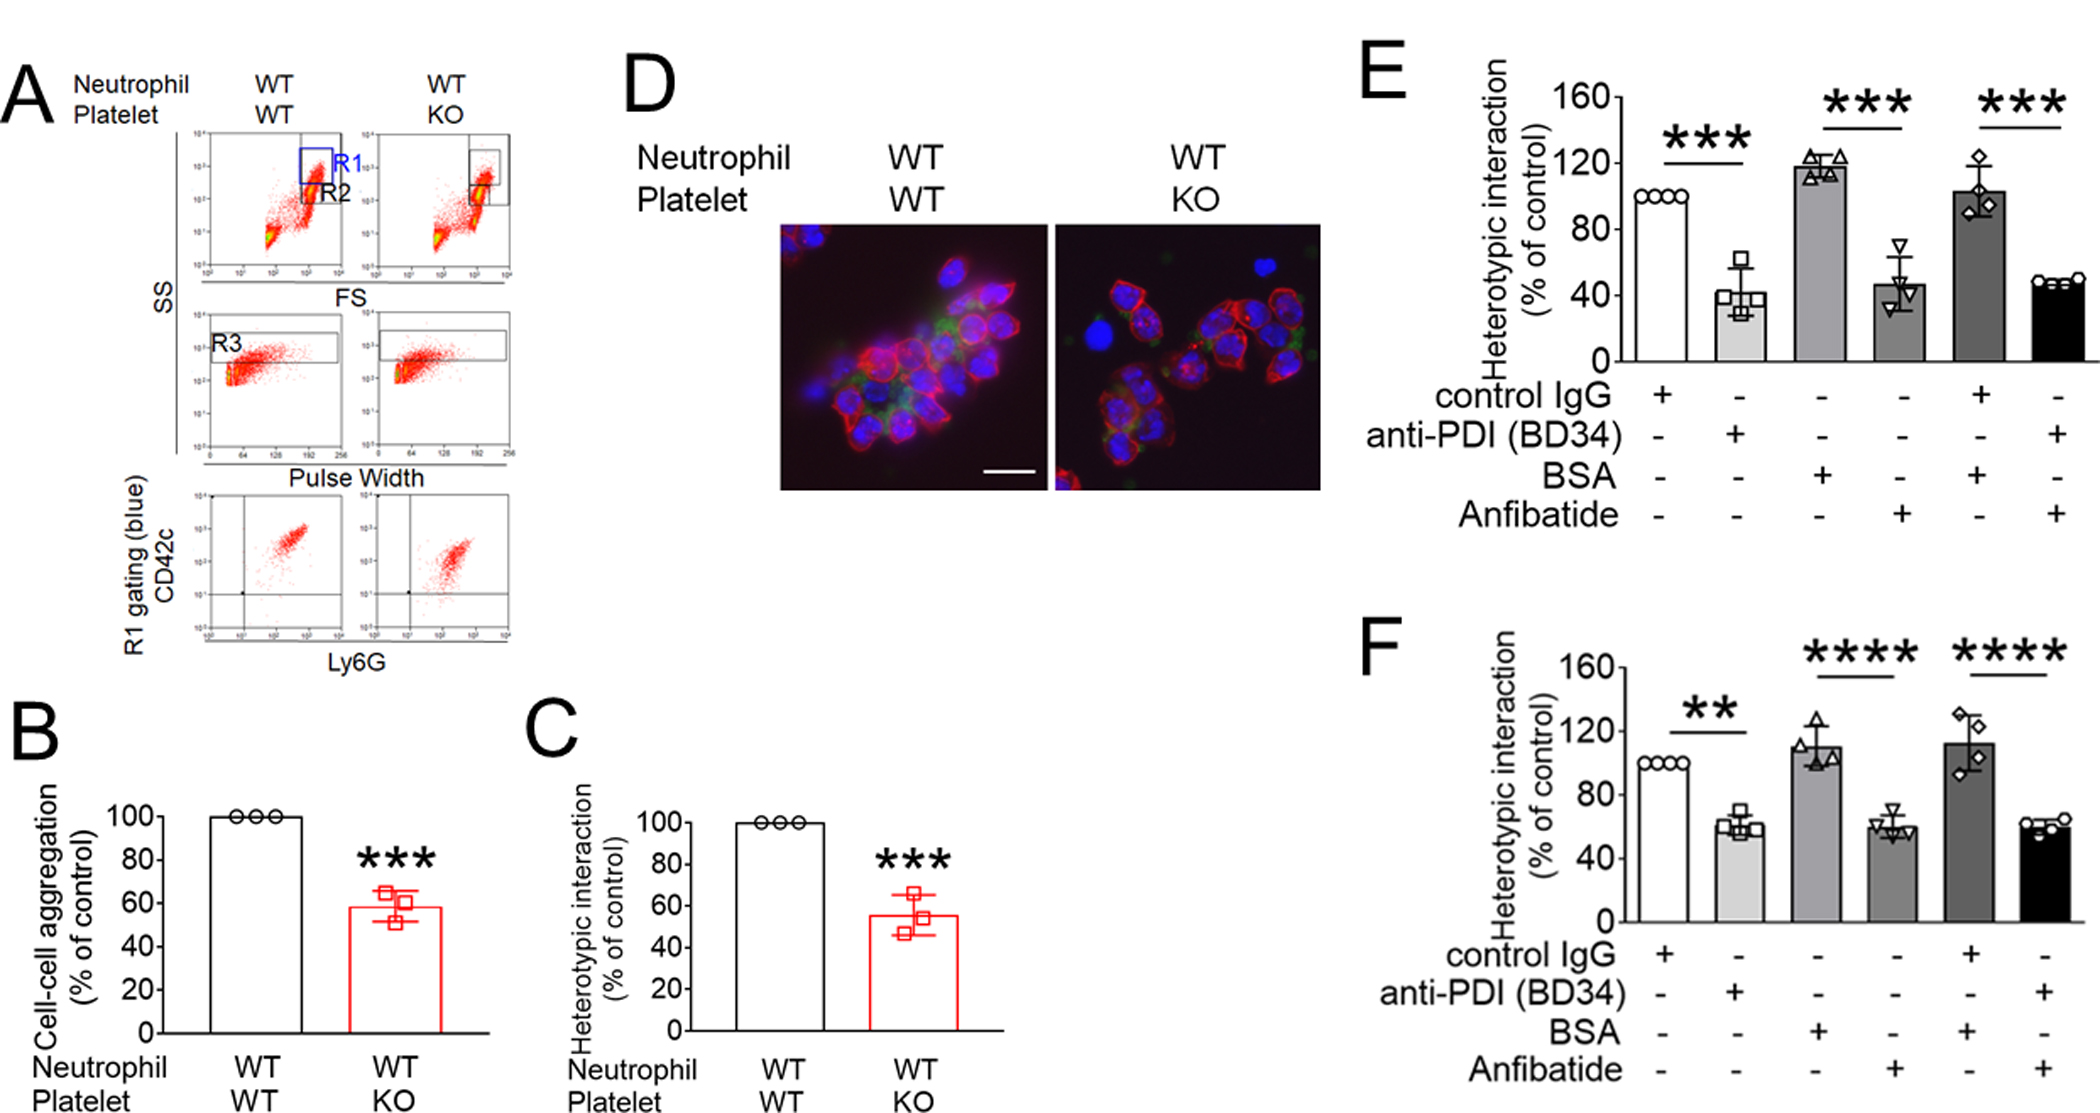
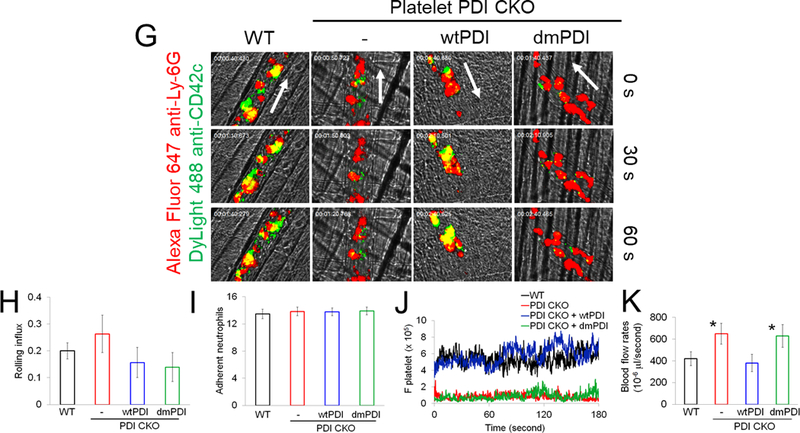
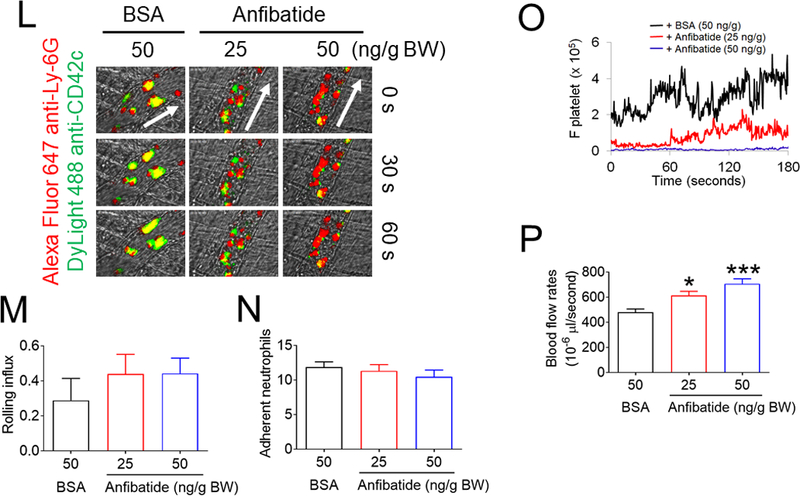
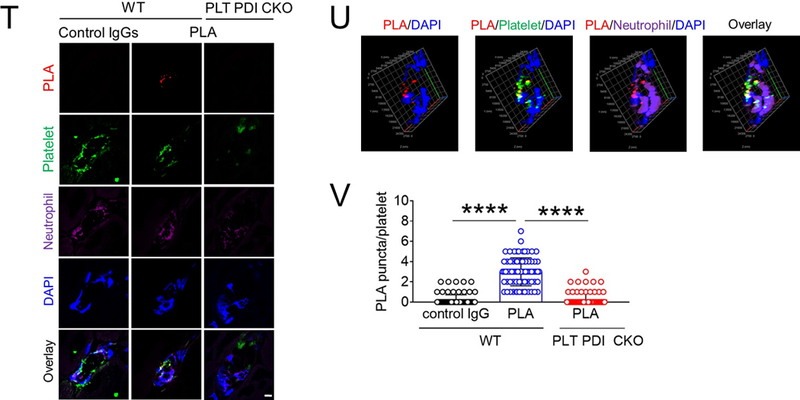
Figure 4. Platelet PDI-regulated GPIbα function is important for platelet-neutrophil aggregation under inflammatory conditions.


(A-F) In vitro platelet-neutrophil aggregation assay was performed using (A-E) mouse and (F) human cells under shear-mimicking conditions as described in Methods. (A) R1, platelet-neutrophil aggregates; R2, neutrophils; and R3, the number of cell aggregates in the R1 gate. Cell-cell aggregation was measured by (B) the number of cell-cell aggregates and (C, E, and F) the fluorescence intensities of anti-CD42c antibodies in the R1 gate (Heterotypic interaction). The number of cell-cell aggregates and the fluorescence intensity of an anti-CD42c antibody in (B-C) WT platelets and neutrophils or (E-F) control IgG-treated cells were shown as 100%. (D) Antibody-labeled neutrophils and platelets were mixed under a stirring condition, followed by cytospin and fluorescence microscopy. Neutrophils: red, platelets: green, and DAPI: blue. Bar = 10 μm. (G-P) Vascular inflammation was induced by intrascrotal injection of TNF-α into (G-K) WT littermate control and platelet-specific PDI CKO mice or (L-P) WT (C57BL/6) mice, followed by real-time intravital microscopy as described in Methods. (G-K) In some experiments, wtPDI or dmPDI (4 μg/g BW) were infused into PDI CKO mice. (L-P) BSA (50 ng/g BW) or Anfibatide (25–50 ng/g BW) was infused into WT mice 3 hours after intrascrotal injection of TNF-α. (G and L) Representative images at various time points. Arrows show the direction of blood flow. (H, I, M, and N) The numbers of rolling and adherent neutrophils. (J and O) The integrated median fluorescence intensities of anti-CD42c antibodies (F platelets) were normalized to the number of adherent neutrophils and plotted as a function of time. (K and P) Blood flow rates were calculated by centerline velocity of Alexa Fluor 488-conjugated microspheres. (Q-R) WT platelets were labeled with calcein AM and incubated without or with 10 µg/ml of control IgG or anti-PDI antibodies, 0.2 µg/ml of BSA or Anfibatide, or both inhibitors. The labeled platelets (2 × 10⁸ in 100 μl per mouse) were infused into WT (C57BL/6) mice treated with intrascrotal injection of TNF-α. Endogenous neutrophils were visualized by infusion of Alexa Fluor 647-conjugated anti-Ly-6G antibodies. A representative image (Q) was obtained in mice infused with control IgG-treated platelets. (S) The same adoptive transfer experiment was performed with WT, hIL4R/GPIbα, littermate WT control (cont), or PDI-null platelets. The recipient TNF-α-challenged WT mice were treated without or with eptifibatide (10 μg/g BW), followed by infusion of platelets. The number of infused platelets that attach to adherent neutrophils was counted and normalized to the number of neutrophils. (T-V) The proximity ligation assay (PLA) was performed as described in Methods. Representative immunohistochemical stainings of the cremaster muscle sections and PLA signals were obtained from 6 different sections (20 different vessels) in 3 different mice per group. Platelets: green, PLA signal: red, and neutrophils: purple (pseudocolor). (U) Z-stacks of PLA signal were obtained from WT mice. Bar = 5 μm. Data represent the mean ± SD (B-F and V, n = 4) or SEM (H-S, n = 30–36 venules in 6 mice per group (H-P) or n = 20–22 venules in 4–5 mice per group (Q-S)). *P < 0.05, **P < 0.01, ***P < 0.001, or ****P < 0.0001 after student’s t-test (for B-C) or ANOVA and Tukey’s test (for E-V).
