Figure 2.
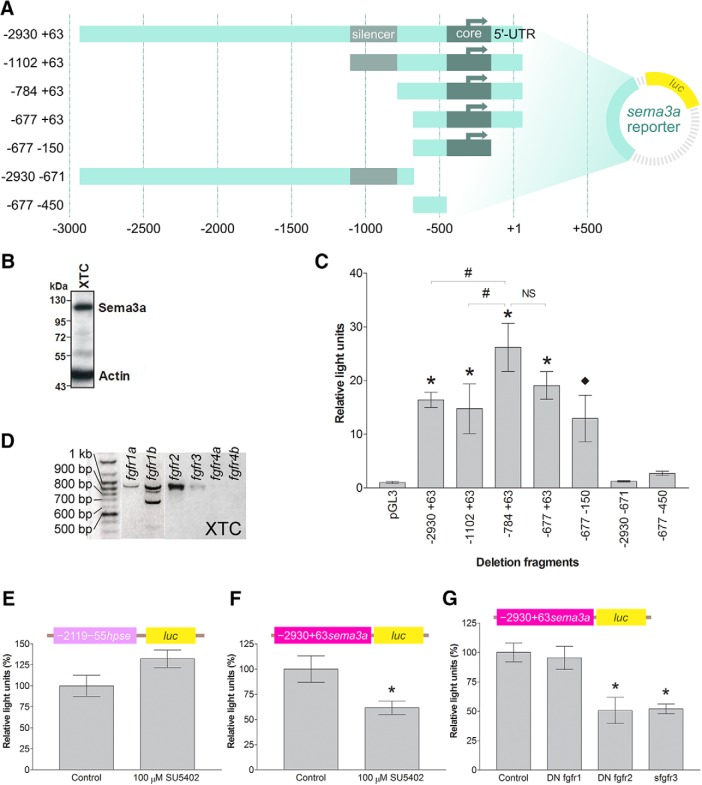
Characterization of the sema3a promoter. A, Schematic of the sema3a deletion fragments inserted upstream of the firefly luciferase (luc) gene in the pGL3 vector. B, XTC cells express endogenous Sema3a protein by Western blotting. C, The reporter constructs of the sema3a promoter fragments and the Renilla luciferase construct were co-transfected into XTC cells. Luminescence corresponding to each deletion fragment was normalized to Renilla to account for transfection efficiency and expressed as relative light units compared to the promoterless pGL3 basic vector. Each bar represents mean ± SEM from n = 9 wells, N = 3. Statistical significance was determined by one-way ANOVA (α = 0.05) and the following post hoc tests: ♦p < 0.05 and *p < 0.01 by Dunnett’s multiple comparison test versus the control (pGL3 vector) and #p < 0.05 by Bonferroni’s multiple comparison test between selected deletion fragments. D, Expression of fgfr genes in XTC cells, shown by RT-PCR. XTC cells express all the fgfr genes (as verified by sequencing of amplicons) except for fgfr4a/b. Of note, the fgfr1b amplicons smaller than 900 bp may be alternatively spliced variants (Friesel and Dawid, 1991). E, F, The heparanase promoter construct (E, n = 12 wells, N = 2 for both bars), –2119 –55 hpse::luc, and the –2930 +63 sema3a::luc construct (F, n = 12 wells, N = 3 for both bars) were co-transfected into XTC cells in 96-well plates with the Renilla luciferase plasmid and treated with 100 µM SU5402. Bars reflect mean ± SEM; *p < 0.05, compared to DMSO control, two-tailed Student’s t test. G, –2930 +63 sema3a::luc was co-transfected with truncated fgfrs in XTC cells (N = 7 for all bars; control n = 30 wells, DN fgfr1 n = 16 wells, DN fgfr2 n = 12 wells, sfgfr3 n = 14 wells). Bars reflect mean ± SEM; *p < 0.05 by ANOVA and Bonferroni post hoc test compared to pCS2-GFP transfection as control.

