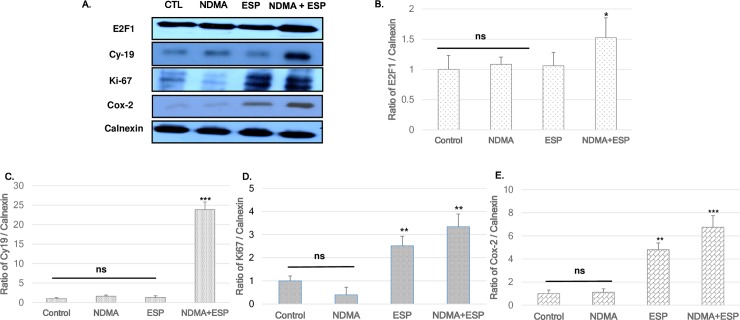
Fig 2. Expression of E2F1, Ki-67, Cy-19, and Cox-2 in H69 cells after treatment with NDMA and ESP, assessed by western blotting.
H69 cells were incubated with PBS (vehicle), NDMA, ESP, or both for 72 h. The cells were collected for protein extraction. A. The blots of each groups were run under same experimental conditions and the images were cropped from different parts of the same gels. B-E. Quantification of relative E2F1, Ki-67, Cy-19, and Cox-2 expression in each group. The each proteins level are indicated as normalization of the ratio of E2F1/Calnexin, Ki-67/Calnexin, Cy-19/Calnexin, and Cox-2/Calnexin. DATA represent the mean ± SE of five independent experiments.*P < 0.05, **P < 0.01 and ***P < 0.001 versus control.

