
Figure 5.
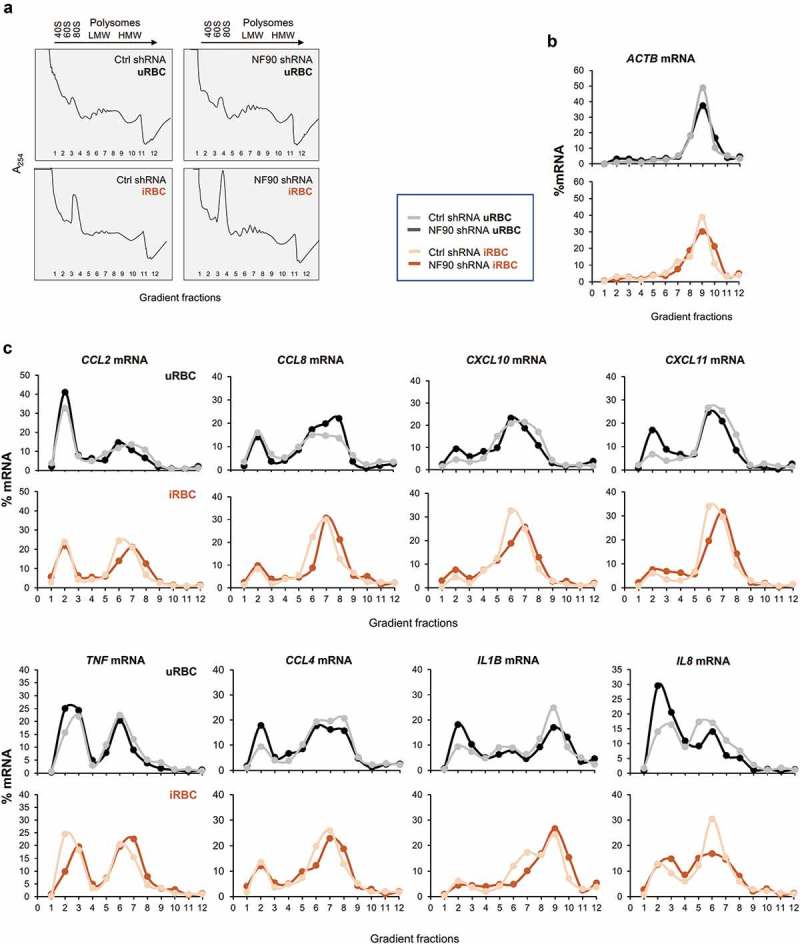
Polysome distribution analysis of NF90 target mRNAs in response to P. falciparum antigens. (a) Cytoplasmic lysates from the THP-1 cell populations described in Figure 1(a) that had been treated with uRBC or iRBC lysates for 48 h were fractionated through sucrose gradients (10–50%), revealing the polysome traces shown. RNA was then extracted from fractions 1 and 2 (free RNA/RNPs), fractions 3 and 4 [ribosomal subunits (40S, 60S) and monosomes (80S)], fractions 5–8 [low-molecular-weight (LMW) polysomes], and fractions 9–11 [high-molecular-weight (HMW) polysomes]; fraction 12 typically had little or no RNA. (b,c) The relative distribution of ACTB mRNA, expressing a housekeeping protein (β-Actin), was assessed by RT-qPCR analysis and the relative levels of ACTB mRNA in each fraction (%) relative to the total ACTB mRNA in the gradient was plotted in order to identify global changes in translation as a function of NF90 levels and exposure to P. falciparum (b). The relative distribution from NF90 target mRNAs was assessed as described in (b) and plotted individually for the mRNAs shown. The data are representative of two independent analyses yielding similar results.