Figure 1.

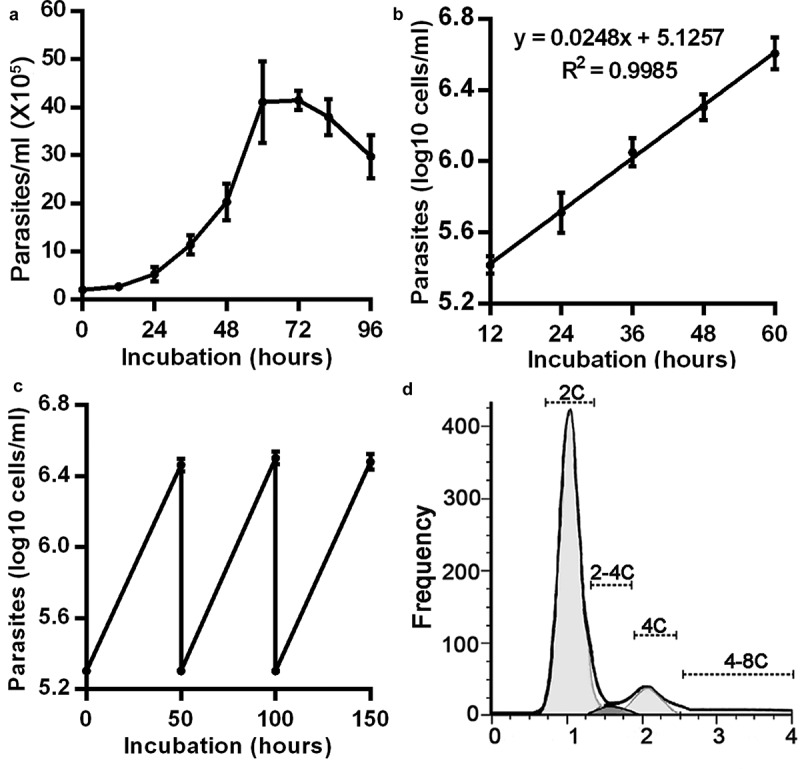
Growth curves and properties of Kinetoplast and Nuclear (K/N) configurations of T. lewisi in in vitro bloodstream cultures. (a) A typical growth curve of T. lewisi bloodstream forms during in vitro cultivation. Parasites (2 × 10⁵) were inoculated in RPMI-1640 with 10% FBS, supplemented with a feeder layer of rat embryo fibroblasts cells, and were continually monitored for 96 hours. (Values indicate the mean ± standard error of the mean of three replicates). (b) The growth curve using the first 60 hours of data (from (a)) transformed to a log scale. Trend line analysis shows the doubling time as 12.14 hours (calculated from log2/0.0248). (c) Growth curve of T. lewisi where cells were repeatedly subcultured at 50-hour intervals (covering the logarithmic growth phase) to confirm the doubling time of 12.14 hours. (d) Flow cytometry analysis was conducted, using the propidium iodide (PI) DNA stain, and a histogram of DNA content was analyzed to determine the proportions of cells in each phase. Based on 10,000 events, proportions were recorded as follows: G1-phase (2C, 81.16%), S-phase (2C-4C, 3.04%) and G2-phase (4C, 10.44%) and others (4C-8C, 5.36%).
