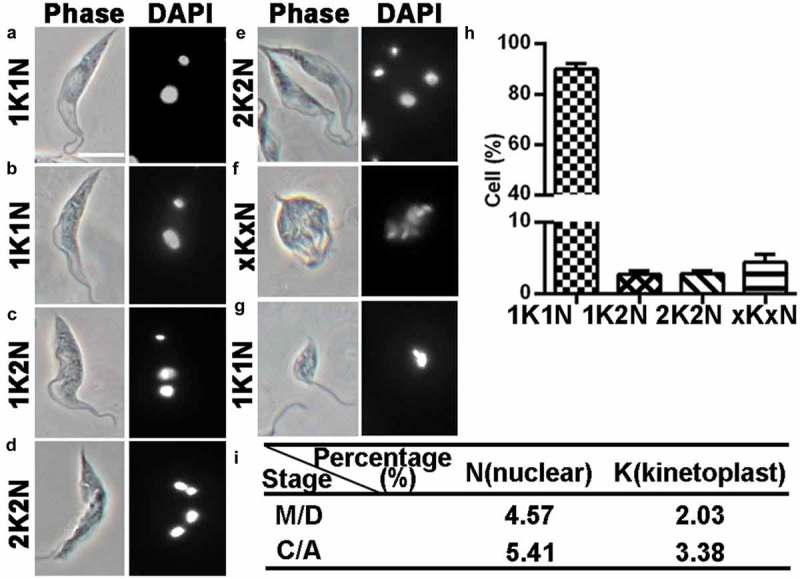
Figure 2.

DAPI staining of T. lewisi cells to determine the distribution of kinetoplasts and nuclei. A logarithmic growing culture of 5 × 10⁶ cells were fixed in 4% paraformaldehyde, permeabilized and stained with DAPI and the cells characterized. (a) Trypomastigote with 1K1N (G1/2, S-phase), (b) with 1K2N (M-phase), (c) with 1K2N (C-phase), (d and e) with 2K2N (C-phase), (f) with xKxN, (g) epimastigote form with 1K1N, (h) Proportion of the cells with different number of nucleus (N) and kinetoplast (K) configurations in a logarithmic growth and (i) proportion of M/D, C/A cells. n = 562, mean value ±sem. Scale bar represents 10 μm.
