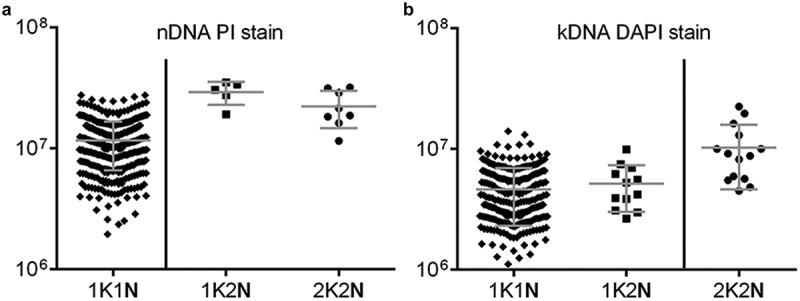
Figure 4.

Replication of nDNA prior to kDNA could be verified based on DNA intensity analysis using PI and DAPI stains. The cells were fixed and stained with DAPI/PI and the detection of DNA intensity in the exponentially growing cells was measured by software programme Image J (mean ± standard deviation) for 1K1N, 1K2N, 2K2N arrangements of the nuclei and kinetoplasts, respectively. (a) For the nucleus, the mean of the nDNA intensity in a single cell of 1K2N (n = 5) and 2K2N (n = 8) cells are two-fold higher than 1K1N (n = 380) cells, due to the nDNA duplicating completely in cells containing 2 nuclei. (b) For the kinetoplast, the mean intensity of the kDNA in a single cell of 2K2N (n = 12) cells is two-fold higher than that in the 1K1N (n = 494) and 1K2N (n = 14) cells, due to the nDNA being duplicated completely in cells with 2 kinetoplasts.
