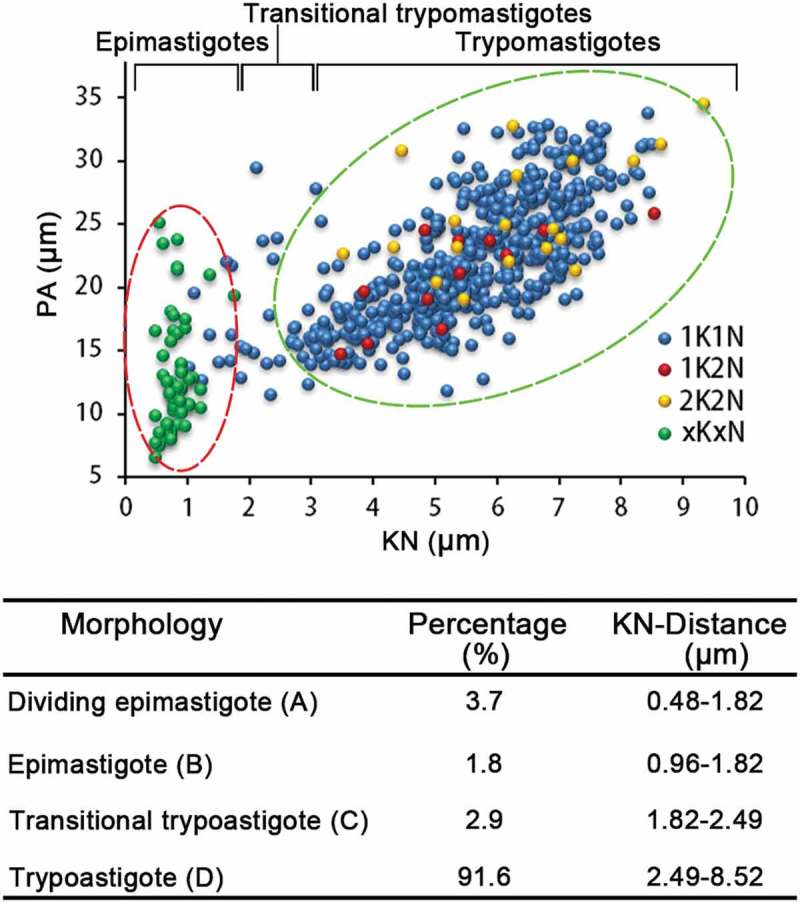
Figure 6.

Scatter plot analysis of the two cell cycles of T. lewisi based on morphological characteristics. Cell body (PA) length and distance between the Kinetoplast and Nucleus (KN) was measured in a heterogeneous range of cells, by Photoshop (Adobe), and resolved in a scatter plot. The division of epimastigotes (multiplication division) and trypomastigotes (generated by binary fission) were grouped in circles of red and green dotted lines, respectively. 1K1N cells within each of the two circles were classified as epimastigotes and trypomastigotes, while the rest that fell between the two circles were defined as transitional trypomastigotes. n = 597. Percentage of cells within the population exhibiting in the table below.
