. 2019 Apr 1;8:e43473. doi: 10.7554/eLife.43473

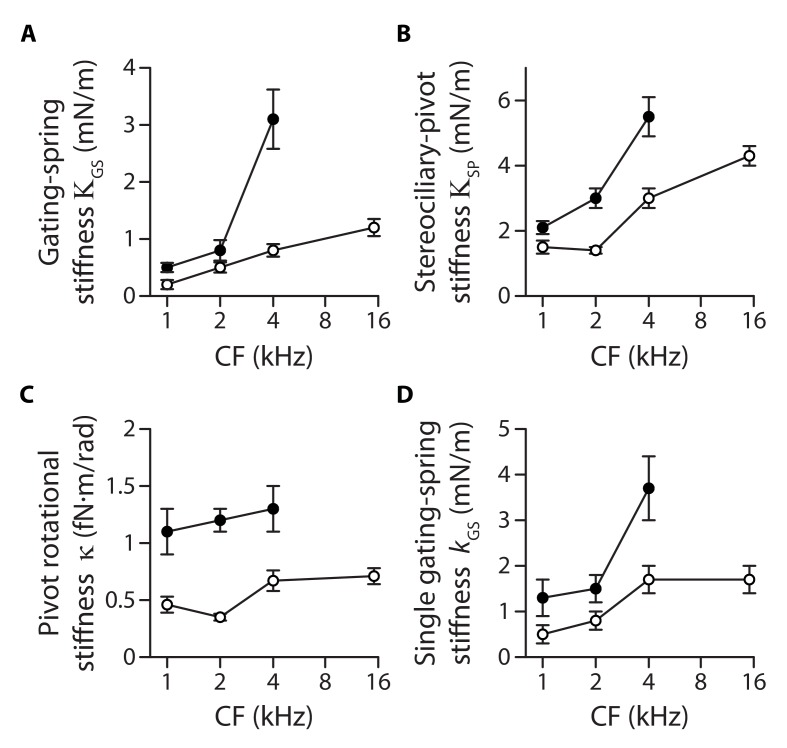
Figure 3. Stiffness gradients of the gating springs and of the stereociliary pivots.

Stiffness (A) of the contribution of the gating springs (ΚGS=rΚHB), (B) of a hair bundle after tip-link disruption, corresponding to the contribution of the stereociliary pivots (ΚSP=1-rΚHB), (C) of a single stereociliary pivot (κ=ΚSPh2/NSP), and (D) of a single gating spring (kGS=KGS/(γ2NTL)) as a function of the characteristic frequency (CF) for inner (white disks) and outer (black disks) hair cells. These stiffnesses were calculated from measured values of the hair-bundle stiffness ΚHB (Figure 2), the amplitude ratio 1-r of hair-bundle movements before and after tip-link disruption (Figure 3—figure supplement 1), the hair-bundle height h and the number of stereocilia NSP (Figure 3—figure supplement 2), and the average number NTL of intact tip links (Figure 3—figure supplement 3). Each data point is the mean ± SEM; SEMs were calculated as described in the Materials and methods.

Figure 3—source data 1. Morphological parameters of inner and outer hair-cell bundles.
Data correspond to mean values ± SEM, with the number of cells indicated in parentheses. The width W and height h of the hair bundle are used to calculate an effective hydrodynamic radius RHB (see Equation (1) in Materials and methods) and plotted as a function of the hair cell’s characteristic frequency in Figure 3—figure supplement 2.
DOI: 10.7554/eLife.43473.015
Figure 3—source data 2. Statistical significance.
The table lists p-values resulting, respectively, from a one-way ANOVA to assay statistical significance of the measured mean-value variation of a given variable between different cochlear locations for inner (IHC) and outer (OHC) hair cells, from two-tailed unpaired Student's t-tests with Welch’s correction to compare mean values of the variable between two groups of a given hair-cell type (IHC or OHC) with different characteristic frequencies (CF) or between the two cell types (OHC/IHC) when they are associated to the same characteristic frequency. The last entry provides the p-value to assay the statistical significance between the slopes of a weighted linear regression of the relation between the variable and the characteristic frequency of the hair cell. A bold font was used to help find statistically significant differences. The variables in the table correspond to the relative contribution r and the absolute contribution ΚGS of the gating springs to the hair-bundle stiffness, the contribution ΚSP of the stereociliary pivots to the hair-bundle stiffness, the rotational stiffness κ of a single stereocilium, and the stiffness kGS of a single gating spring.
DOI: 10.7554/eLife.43473.016
Figure 3—source data 3. Gating-spring contribution to the hair-bundle stiffness.
DOI: 10.7554/eLife.43473.017
Figure 3—source data 4. Hair-bundle morphology along the tonotopic axis.
DOI: 10.7554/eLife.43473.018
Figure 3—source data 5. Transduction currents and number of intact tip links along the tonotopic axis.
DOI: 10.7554/eLife.43473.019

Figure 3.

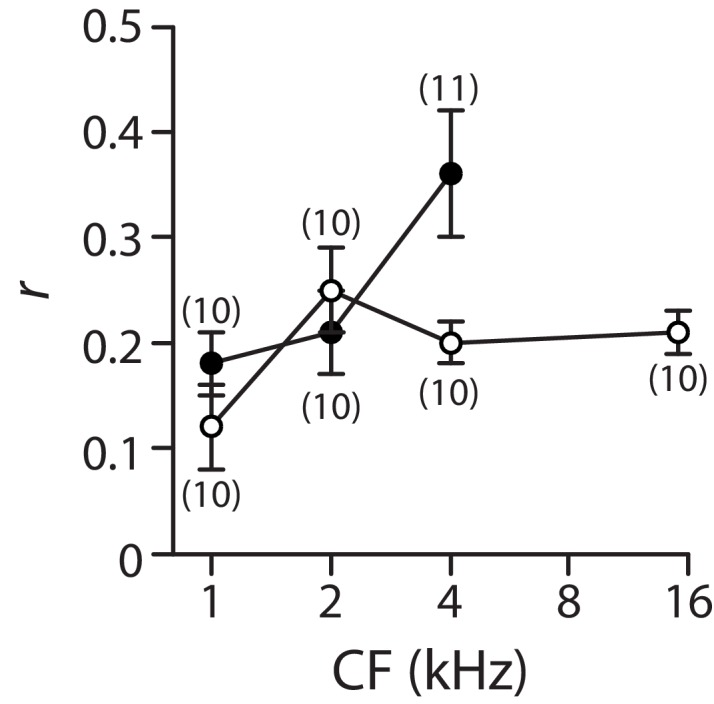
Figure 3—figure supplement 1. Gating-spring contribution to the hair-bundle stiffness.

Figure 3—figure supplement 1.

We measured the amplitude of the hair-bundle movement evoked by a sinusoidal fluid-jet stimulus before (amplitude X1) and after (amplitude X2) application of EDTA iontophoresis (see an example in Figure 4A of the main text). The ratio r=X2-X1/X2 is here plotted as a function of characteristic frequency (CF) for inner (white disks) and outer (black disks) hair cells. Because EDTA disrupted the tip links, the ratio r=ΚGS/ΚHB quantifies the contribution ΚGS of the gating springs to the stiffness ΚHB of an intact bundle; the complementary ratio, 1-r=ΚSP/ΚHB, represents the relative contribution of the stereociliary pivots, of stiffness ΚSP. Error bars correspond to mean values ± SEM, with the number of cells indicated on the figure. These experiments were performed in low-Ca2+ saline.
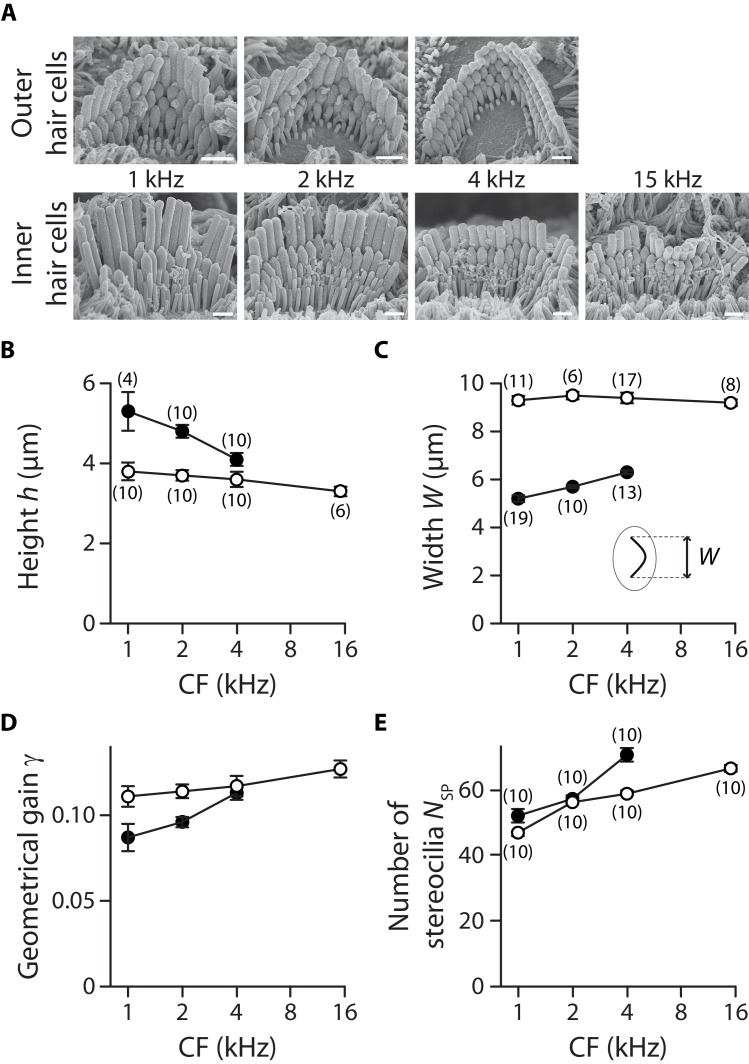
Figure 3—figure supplement 2. Hair-bundle morphology along the tonotopic axis.

Figure 3—figure supplement 2.

We used electron microscopy to count the number of stereocilia in a hair bundle. To avoid dehydration artefacts, we used instead optical microscopy to measure the width and height of the hair bundle. To measure width, the hair bundle was visualized from above (Figure 1). To measure height, the hair bundle was visualized from the side after it had been pushed against the apical surface of the hair cell with a glass rod. (A) Electron micrographs of typical outer (top row) and inner (bottom row) hair cells at cochlear locations corresponding to characteristic frequencies indicated on the figure. Tension in the tip links results in stereociliary tips with a prolate shape, which is also indicative of tip-link orientation. Scale bars: 1 µm. The height h (B), width W (C), geometrical gain γ (D), and number of stereocilia NSP (E) of a hair bundle are plotted as a function of the characteristic frequency (CF) for inner (white disks) and outer (black disks) hair cells. In panel (C), the inset shows a schematic top view of a hair bundle and indicates how the bundle’s width was measured. The geometrical gain was calculated as the ratio of the interstereociliary spacing and the hair-bundle height, assuming an interstereociliary spacing of 462 nm for all outer hair cells and 420 nm for all inner hair cells. The error bars in (B), (C) and (E) represent standard errors of the means with numbers of cells indicated between brackets; in (D), error bars are calculated as described in the Materials and methods.
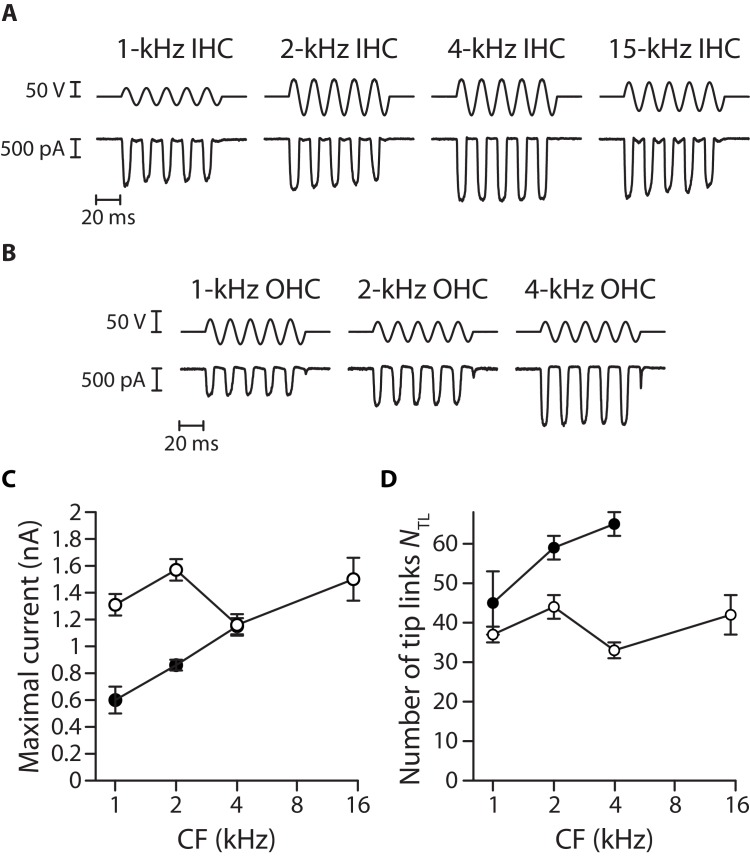
Figure 3—figure supplement 3. Transduction currents and number of intact tip links along the tonotopic axis.

Figure 3—figure supplement 3.

A large mechanical stimulus (top; fluid-jet voltage command) was applied to the hair bundle to estimate the magnitude of the transduction current (bottom) at saturation in inner hair cells (A) and outer hair cells (B) along the tonotopic axis of the cochlea. Maximal current (C) and estimated number NTL of tip links ((D); see Materials and methods) are plotted as a function of the characteristic frequency (CF) for inner (white disks) and outer (black disks) hair cells. Error bars correspond to mean values ± SEM, with n = 10 cells for all data points. In panels (A and B), the hair cell’s characteristic frequency is indicated above each recording; the frequency of stimulation was 60 Hz. In these experiments, the hair cells were immersed in standard saline at a Ca2+ concentration of 1.5 mM.