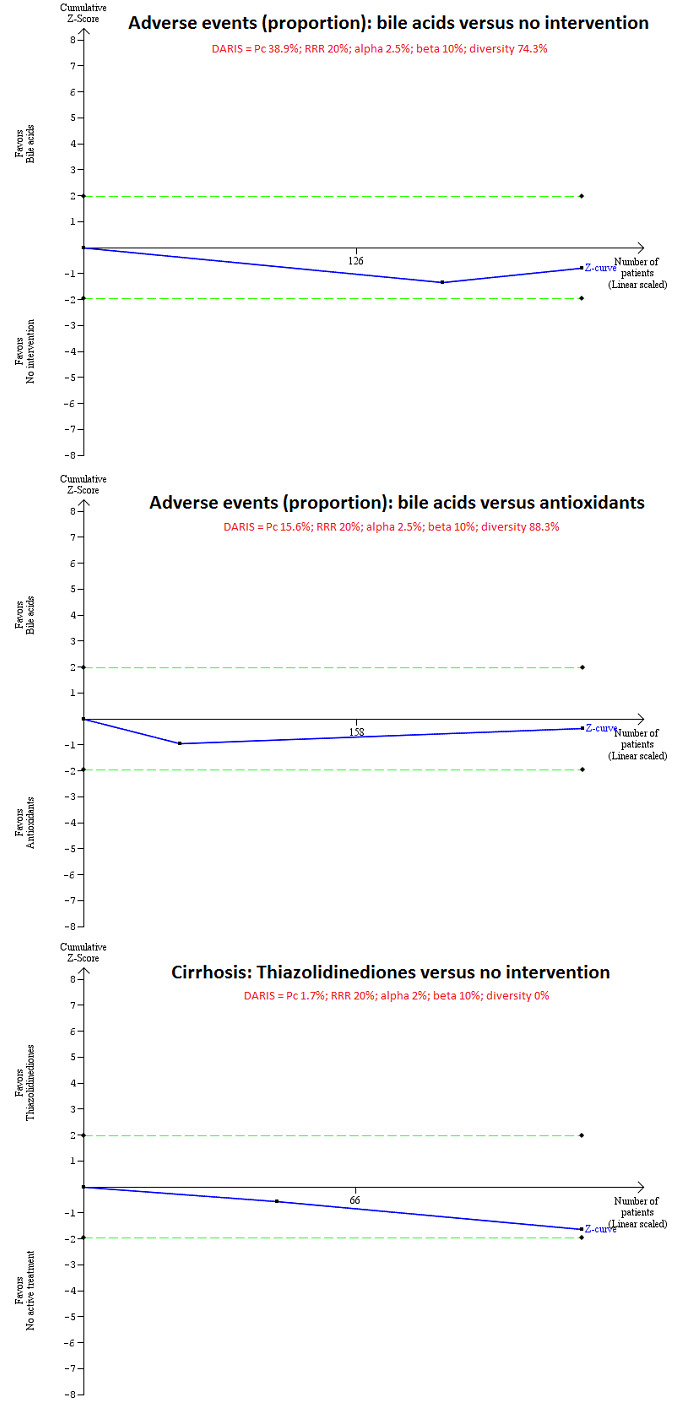
4.

Trial Sequential Analysis (TSA) for adverse events (proportion) and cirrhosis for different comparisons. TSA was performed using an alpha error of 2.5% for adverse events (proportion) and 2% for cirrhosis, power of 90% (10% beta error), 20% relative risk reduction (RRR), control group proportion (Pc) observed in the trials, and the diversity observed in the meta‐analysis. The trial sequential monitoring boundaries were not drawn because the accrued sample sizes (adverse events (proportion): bile acids versus no intervention = 230 participants; adverse events (proportion): bile acids versus antioxidants = 289 participants; cirrhosis: thiazolidinediones versus no intervention = 121 participants) were only fractions of the diversity‐adjusted required information size (DARIS) (adverse events (proportion): bile acids versus no intervention = 52,522 participants; adverse events (proportion): bile acids versus no intervention = 6141 participants; cirrhosis: thiazolidinediones versus no intervention = 67,859 participants). The cumulative Z‐curve (blue line) does not cross the conventional P boundary (dotted green lines). There was a high risk of random error in all comparisons.
