
6.
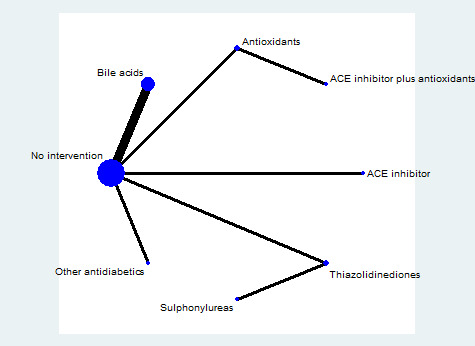
The network plots showing the comparisons in mortality at maximal follow‐up. The size of the node (circle) provides a measure of the number of trials in which the particular treatment was included as one of the arms. The thickness of the line provides a measure of the number of direct comparisons between two nodes (treatments).
Abbreviation: ACE inhibitors = angiotensin‐converting enzyme inhibitors