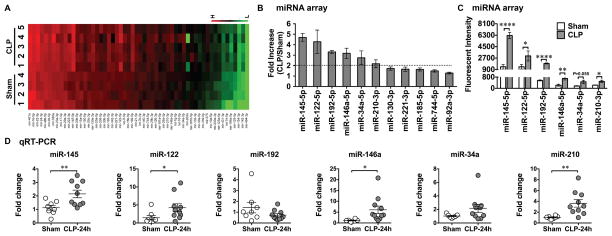
Fig. 4. Plasma miRNA profiling in septic mice.
A. Heat map of miRNA array. Mice were subjected to Sham or CLP procedure. At 24 hours, plasma was collected and miRNAs were analyzed using Firefly microRNA array provided by Firefly BioWorks. Sham (n=4) and CLP (n=5) mice. The fluorescence intensity of 56 miRNAs was expressed from low (green) to high (red). B. Fold change in the plasma miRNAs in the CLP compared to that of Sham mice (CLP/Sham) as measured by miRNA array. C. Mean fluorescent intensity of plasma miRNAs as measured by miRNA array in Sham and CLP mice. Six miRNAs (miR-145, miR-122, miR-192, miR-146a, miR-34a, miR-210) were significantly increased for more than 2-fold in the septic mice compared to the sham control. .* P < 0.05, ** P < 0.01, **** P < 0.001. n=4 in sham group, n=5 in CLP group. D. qRT-PCR validation of miRNAs. The 6 target miRNAs were tested using qRT-PCR in a separate set of plasma. * P < 0.05, ** P < 0.01. n=8 in sham group, n=10 in CLP group.

