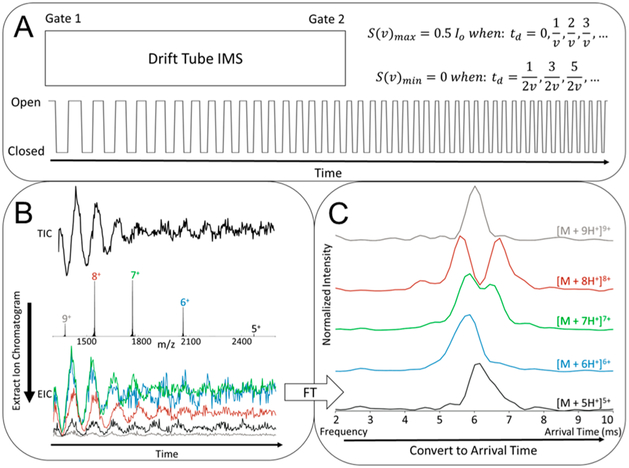
Figure 2.
(A) Dual gates at the entrance and exit of the DT are synchronously pulsed with a square waveform with a linear chirp frequency from 5 to 7000 Hz. Applying this waveform turns the DT into a frequency-dependent filter with transmission characteristics aligning with the stated equations. (B) Mass spectral data is acquired with an associated total ion chromatogram (TIC), from which an extracted ion chromatogram (EIC) can be determined by isolating a single m/z abundance over time. A TIC, MS, and EIC are shown for the model protein cytochrome C. (C) EICs can be Fourier transformed to determine the frequency of transmission, which is correlated to arrival time by a direct relationship. Exemplary ATDs were extracted from the cytochrome C data in panel B.

