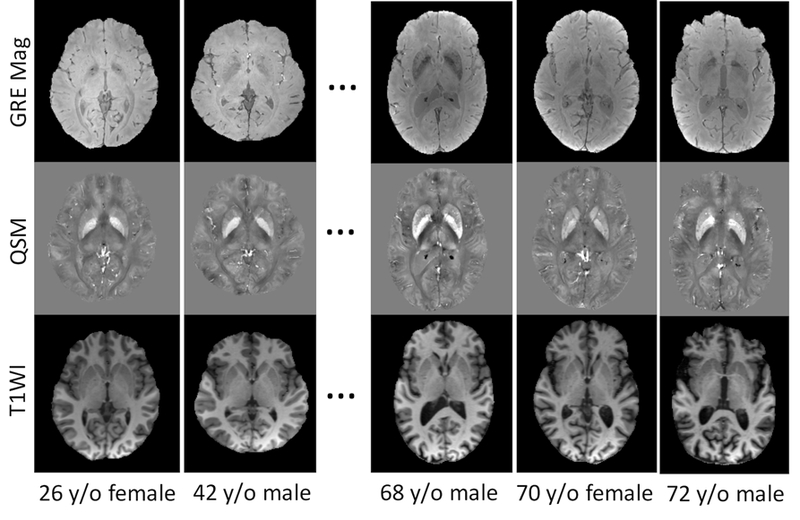
Fig. 1:

Example source images showing the GRE Magnitude, QSM and T1 weighted MPRAGE images of 5 out of the 10 subjects selected to generate the susceptibility multi-atlases. Variable anatomical patterns and different degrees of brain atrophy can be seen among these atlases. The GRE Magnitude images are averaged across different TEs (6ms to 36ms). Gray scales in QSM images are all in [−0.2, 0.2] ppm.
