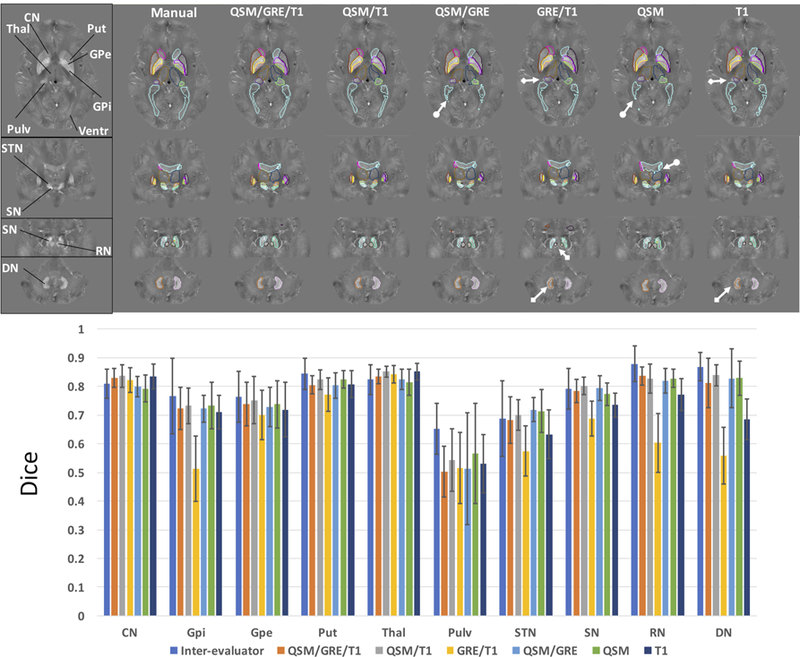
Fig. 3:

Top row shows the comparisons of the segmentation performances of different multi-atlas pipelines using different combinations of contrast channels, i.e. QSM/GRE/T1, QSM/T1, QSM/GRE, GRE/T1, QSM and T1, to the manual delineation overlaid on QSM images of an example subject. Bottom row shows the Dice metrics of agreement with respect to the manual delineation of all the automated brain delineations using these pipelines in the leave-one-out test on the atlas set (n=10) as compared to the inter-evaluators Dice. CN: caudate nucleus, GPi: globus pallidus internus, GPe: globus pallidus externus, Put: putamen, Thal: thalamus, Pulv: thalamic pulvinar, Ventr: ventricles, STN: subthalamic nucleus, SN: substantia nigra, RN: red nucleus, DN: dentate nucleus. Arrows with circular tails mark the inferior delineation performances around ventricles by pipelines that do not utilize T1 contrast, while arrows with square tails mark inferior delineation performances in DN, RN and pulvinar by pipelines that do not utilize QSM contrast.
