6.

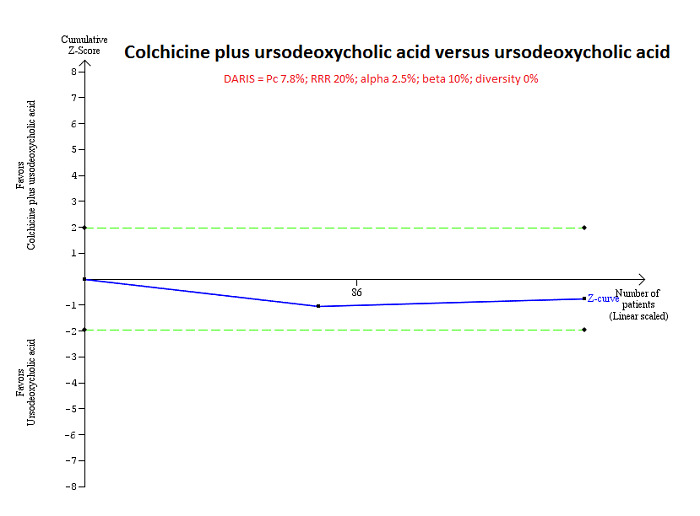
Trial Sequential Analysis of mortality at maximal follow‐up: colchicine plus UDCA versus UDCA.
Based on an alpha error of 2.5%, power of 90% (beta error of 10%), a relative risk reduction (RRR) of 20%, a control group proportion observed in the trials (Pc = 7.8%), and diversity observed in the analyses (0%), the accrued sample size (160 participants) was only a small fraction of the diversity adjusted required information size (DARIS) (13,316); therefore, the trial sequential monitoring boundaries were not drawn. The Z‐curve (blue line) did not cross the conventional boundaries (green dotted line). This indicates that there is a high risk of random errors in both this comparison.
