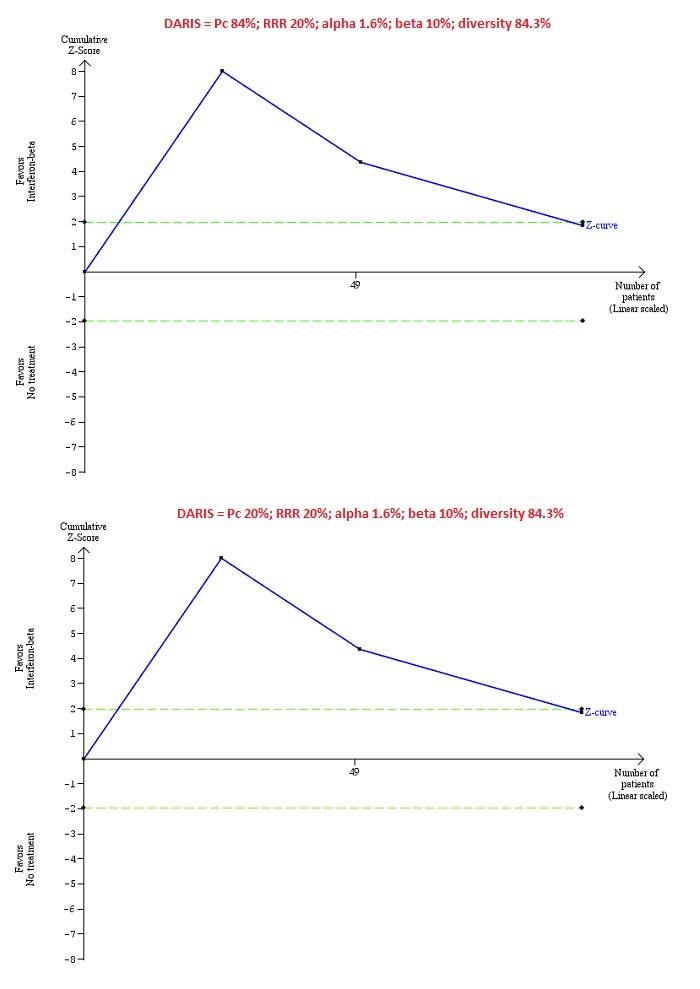
Figure 6.

Trial Sequential Analysis of chronic hepatitis C virus for interferon‐beta versus no intervention performed using an alpha error of 1.6%, power of 90% (beta error of 10%), relative risk reduction (RRR) of 20%, control group proportion observed in the trials (Pc = 84%; upper figure) and a Pc of 20% (lower figure), and observed heterogeneity in the trials (84%) shows that the accrued sample size was only a small fraction of the diversity‐adjusted required information size (DARIS); so the trial sequential monitoring boundaries were not drawn. The Z‐curve (blue line) crosses the conventional boundaries (dotted green line). There is a high risk of random errors.
