6.

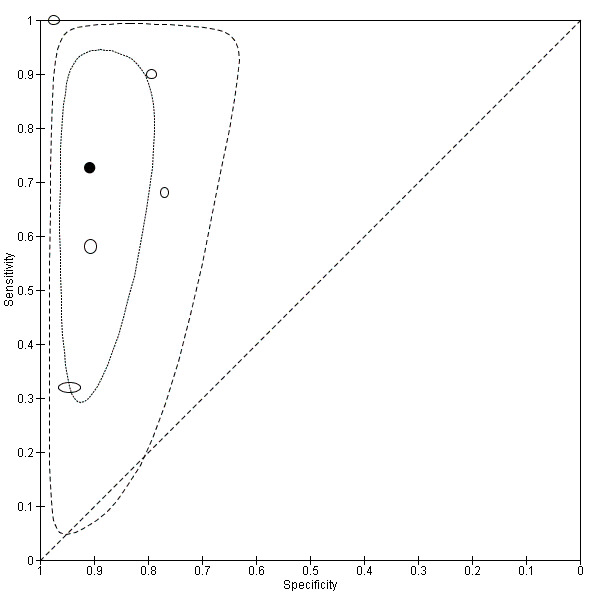
Summary receiver operating characteristic (ROC) plot of ultrasound for detection of common bile duct stones. Each ellipse on the plot represents the pair of sensitivity and specificity from a study and the size of the ellipse is scaled according to the sample size of the study. The solid black circle represents the summary sensitivity and specificity, and this summary point is surrounded by a 95% confidence region (dotted line) and 95% prediction region (dashed line).
