15.

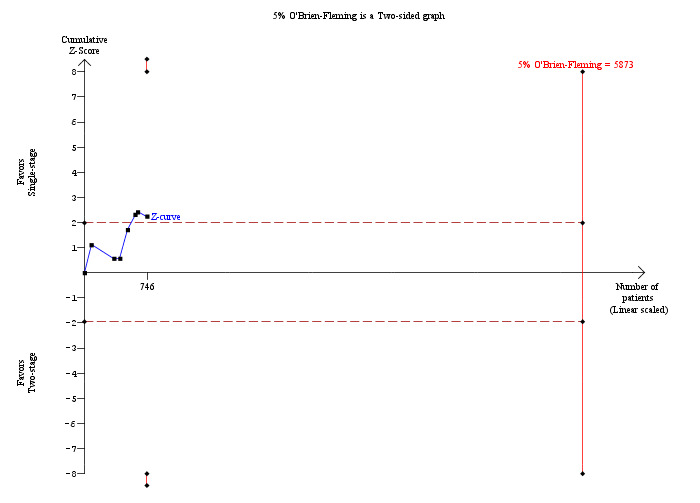
Trial sequential analysis of retained stones (single‐stage versus two‐stage procedures) The diversity‐adjusted required information size (DARIS) was calculated to 9,003 patients, based on the proportion of patients in the control group with the outcome of 13.68%, a relative risk reduction of 20%, an alpha of 5%, a beta of 20%, and a diversity of 49.85%. To account for zero event groups, a continuity correction of 0.01 was used in the calculation of the cumulative Z‐curve (blue line). After accruing a total of 746 participants in seven trials, only 8.29% of the DARIS has been reached. So, the futility area was not drawn. The cumulative Z‐curve does not cross the trial sequential monitoring boundaries (red line) but crosses the conventional boundaries (etched red line). This suggests that although there is statistically significant reduction in the proportion of people with retained stones in the single‐stage group compared to the two‐stage group, there is a high risk of random error and one cannot firmly conclude that single‐stage group has significantly lower retained stones proportion compared to the two‐stage group.
