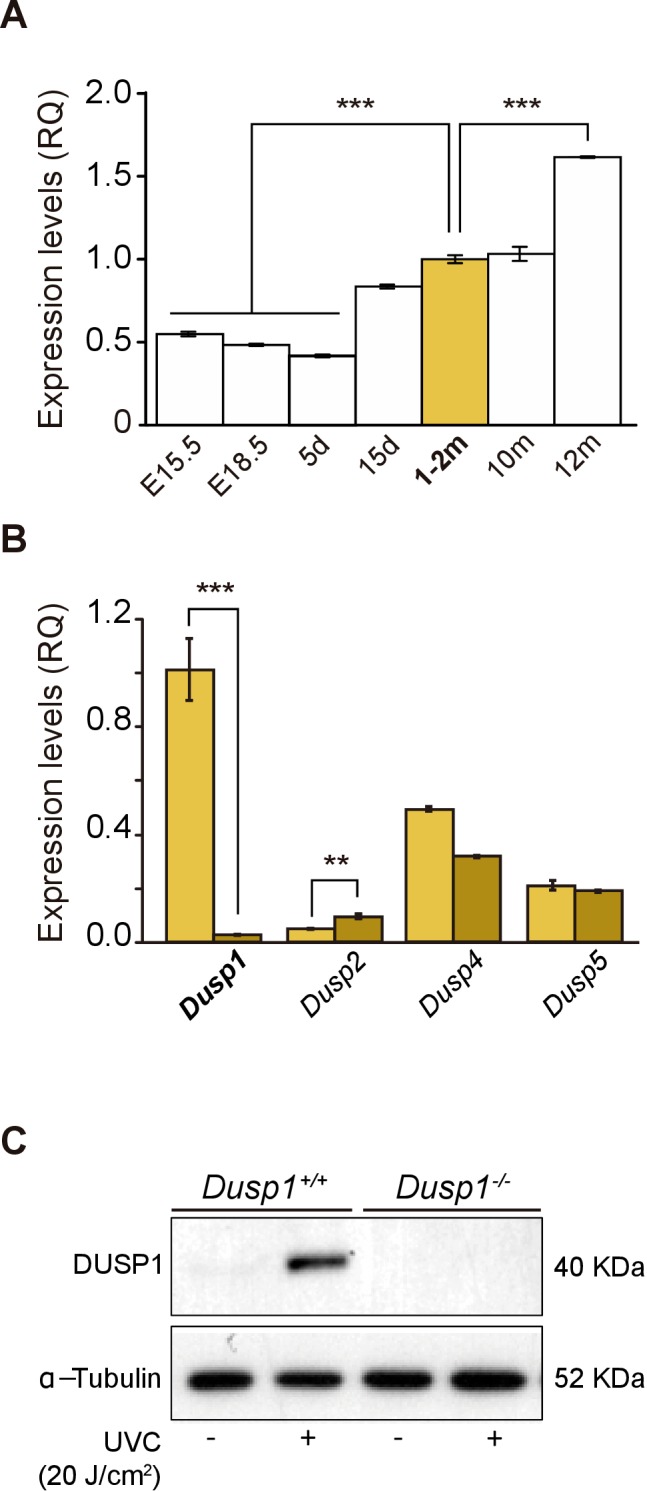
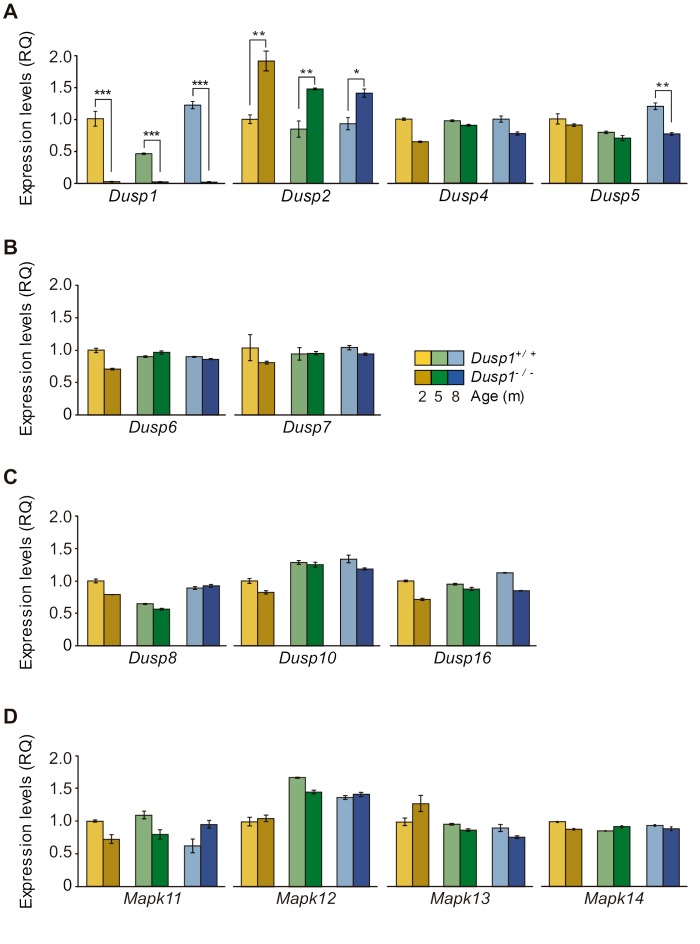
Figure 1. Expression of Dusp1 and related phosphatases in the mouse cochlea.
(A) Cochlear gene expression of Dusp1 in MF1 × 129 Sv mice from embryonic (E) to adult stages (measured in days (d) and months (m)). Expression levels were measured by RT-qPCR and calculated as 2–ΔΔCt (RQ), using Hprt1 as the reference gene and normalized to data from 1–2 month-old mice. Values are presented as mean ± SEM of triplicates from pool samples of three mice per condition. Statistically significant differences were analyzed by Student’s t-test, ***p<0.001. (B) Cochlear gene expression of inducible nuclear MKPs in the cochlea of 2-month-old Dusp1+/+ (light yellow) and Dusp1–/– mice (dark yellow). Expression levels were calculated as 2–ΔΔCt (RQ), using Rplp0 as the reference gene and normalized to 2-month-old wildtype Dusp1 expression. Data are presented as mean ± SEM of triplicates from pool samples of three mice per condition. Statistically significant differences were analyzed by the Student’s t-test (**p<0.01 and ***p<0.001). (C) MEFs cells from Dusp1+/+ or Dusp1–/–mice were treated or not with 20 J/cm2 UVC light and harvested 30 min after stimuation. 20 μg of whole cell extracs (WCE) were resolved in SDS-PAGE and DUSP1 expression was detected using a specific antibody. Tubulin was used as a loading control.


