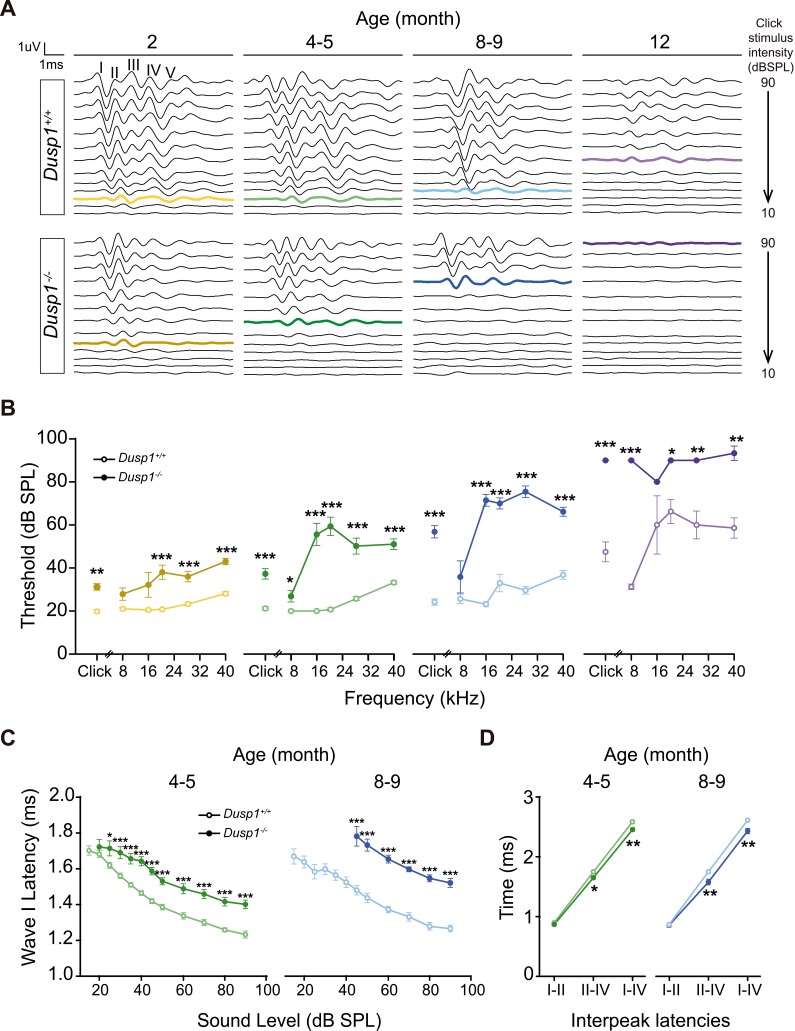
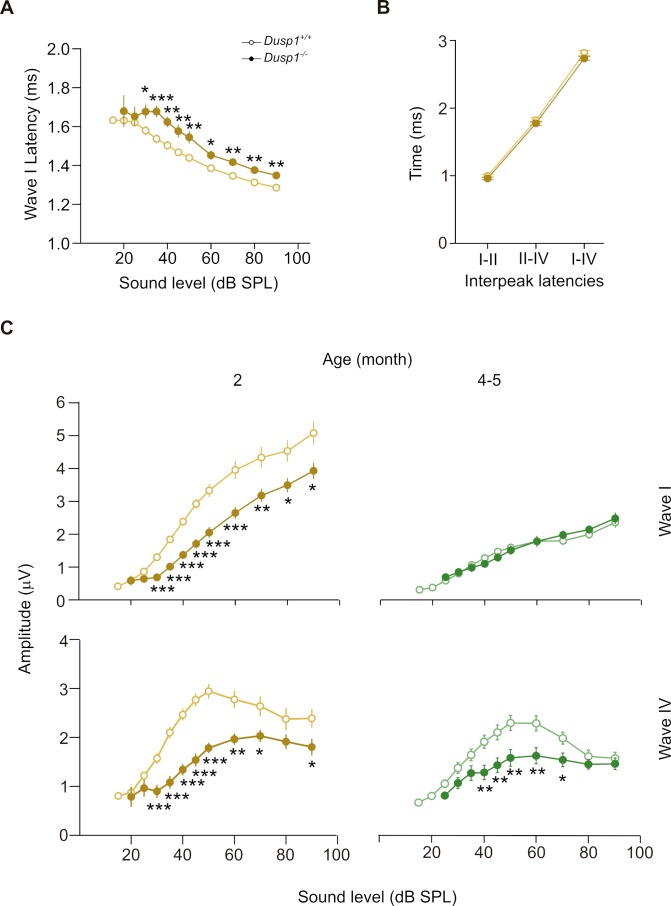
Figure 2. Comparative longitudinal hearing evaluation of Dusp1+/+ and Dusp1–/– mice.
(A) Representative ABR recordings showing the typical I–V waves obtained in response to click stimuli from Dusp1+/+ and Dusp1–/– mice of 2, 4–5, 8–9 and 12 months of age, showing the hearing thresholds (colored bold lines). (B) Evolution of ABR thresholds (mean ± SEM) in response to click and tone burst stimuli in Dusp1+/+ (lighter color lines) and Dusp1–/– (darker color lines) mice of 2 (Dusp1+/+, n = 26; Dusp1–/–, n = 25), 4–5 (Dusp1+/+, n = 25; Dusp1–/–, n = 24), 8–9 (Dusp1+/+, n = 24; Dusp1–/–, n = 22) and 12 months of age (Dusp1+/+, n = 7; Dusp1–/–, n = 3). (C) Input–output function of wave I latency, the mean latency (± SEM) of ABR peak one is plotted against sound intensity (dB SPL) for mice of 4–5 (Dusp1+/+, n = 25; Dusp1–/–, n = 24) and of 8–9 months of age (Dusp1+/+, n = 22; Dusp1–/–, n = 21). (D) Interpeak latency (mean ± SEM) between peaks I–II, II–IV and I–IV obtained at 80 dB SPL click stimulation in mice of 4–5 (Dusp1+/+, n = 25; Dusp1-–/–, n = 24) and 8–9 months of age (Dusp1+/+, n = 21; Dusp1–/–, n = 21). Statistically significant differences were analyzed by Student’s t-test comparing genotypes (*p<0.05, **p<0.01, ***p<0.001).


