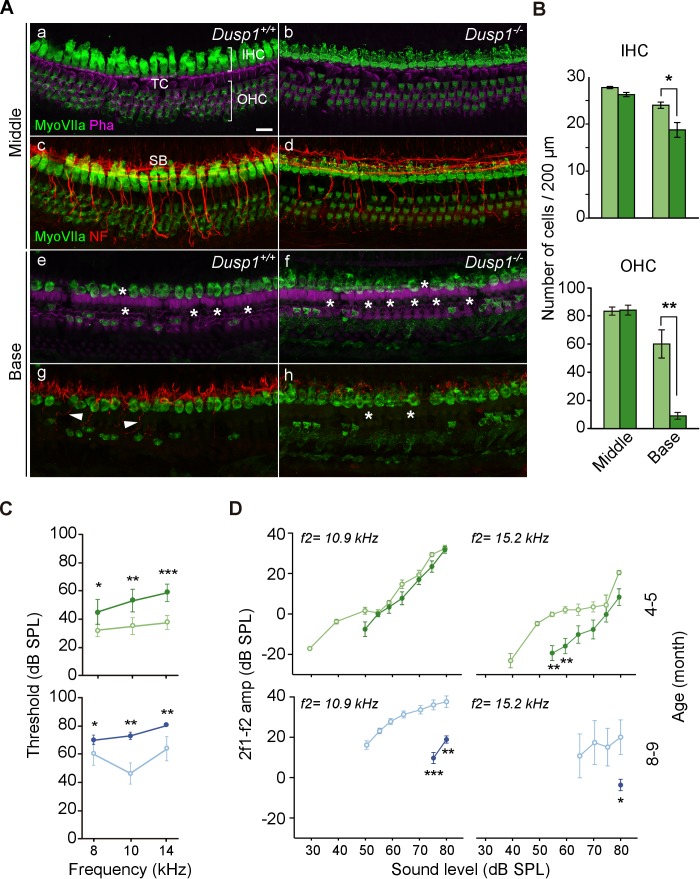
Figure 4. Organ of Corti degeneration in Dusp1–/– mice.
(A) Representative confocal maximal projection images of the organ of Corti of the middle and basal turns of 5-month-old Dusp1+/+ (n = 4) and Dusp1–/– (n = 4) mice immunolabeled for hair cells MyoVIIA (green), neurofilament (red) and phalloidin (purple). Asterisks and arrowheads indicate the absence or presence, respectively, of hair cells and fibers. Scale bar: 10 µm. IHC, inner hair cell; OHC, outer hair cell; SB, spiral bundle; TC, tunnel of Corti. (B) Quantification in the middle (35–45% distance from apex) and basal cochlear turns (60–70% distance from apex) of 5-month-old Dusp1+/+ (light green bars) and Dusp1–/– (dark green bars) mice of the number of outer (base, n = 3 per genotype; middle, n = 4 per genotype) and inner hair cells (base, n = 4 per genotype; middle n = 4, per genotype). Values are presented as mean ± SEM. (C) DPOAE thresholds (mean ± SEM) of Dusp1+/+ (light color lines) and Dusp –/– (dark color lines) mice of 4–5 months of age (8 kHz: Dusp1+/+, n = 5, Dusp1–/–, n = 8; 10 kHz: Dusp1+/+ n = 4, Dusp1–/–, n = 8; 14 kHz: Dusp1+/+ n = 4, Dusp1–/– n = 7) and 8–9 months of age (8 kHz: Dusp1+/+n = 5, Dusp1–/–, n = 5; 10 kHz: Dusp1+/+ n = 4, Dusp1–/– n = 5; 14 kHz: Dusp1+/+ n = 4, Dusp1–/– n = 4). (D) DPOAE amplitude I/O function (mean ± SEM) evoked by stimulus (f2 = 10.9 kHz or f2 = 15.2 kHz) of Dusp1+/+ (lighter color lines) and Dusp1–/– (darker color lines) for mice of 4–5 and 8–9 months of age (at least three mice per genotype). Statistically significant differences were analyzed by Student’s t-tests comparing genotypes (*p<0.05, **p<0.01, ***p<0.001).

