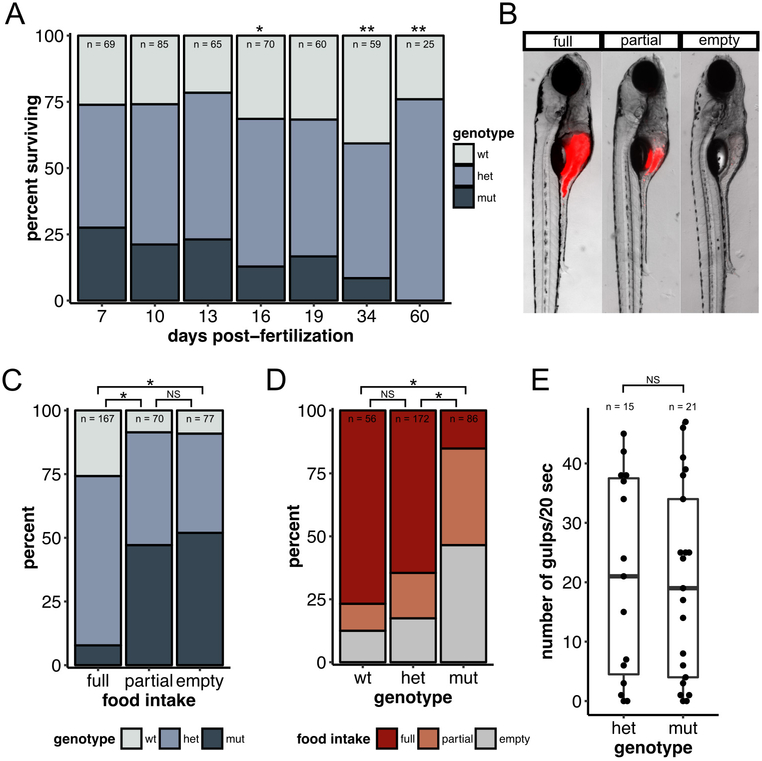
Figure 8 – dscamb mutants have defective feeding behavior and die at 2–3 weeks of age.
A) Percentage of offspring of each genotype from heterozygous dscamb mutant crosses that survived to different time points. Multinomial exact test for goodness-of-fit (predicted proportions wt:het:mut = 0.25:0.75:0.25) p-value: 7dpf = 0.80, 10dpf =0.74, 13dpf =0.73, 16dpf =0.046, 19dpf =0.25, 34dpf =0.0013, 60dpf =0.0017.
B) Representative images of 7dpf larvae in three categories of fluorescent food intake.
C) Percentage of each genotype in each food intake category. Fisher’s exact test of independence across all groups: p = 0.00050. Post-hoc Fisher’s exact test with Bonferroni correction: full × partial p = 1.2e-10, full × empty p = 4.1e-13, partial × empty p = 1.0.
D) Percentage of each food intake category in each genotype. Fisher’s exact test of independence across all groups: p = 0.00050. Post-hoc Fisher’s exact test with Bonferroni correction: wt × het p = 0.81, wt × mut p = 2.2e-12, het × mut p = 1.8e-13.
E) Quantification of number of gulps during a 20sec movie for 7dpf heterozygous and homozygous mutants. Each data point represents one fish. Mann-Whitney-Wilcoxon test: p = 0.99. Middle line is the median; lower and upper ends of boxes are 25th and 75th percentiles.

