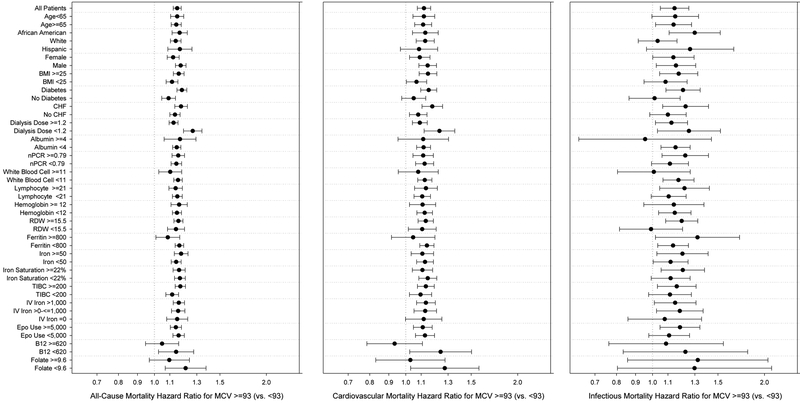
Figure 2.
Subgroup analysis of all-cause (A and B) and cardiovascular (C and D) mortality hazard ratios (and 95%CI error bars) of high MCV (MCV≥93 fl) vs low MCV (MCV <93 fl) across three levels of multivariable adjustment.
Abbreviations: BMI, body mass index; CHF, congestive heart failure; nPCR, normalized protein catabolic rate; RDW, red cell distribution width; TIBC, total iron binding capacity; iv, intravenous; B12, vitamin B12

