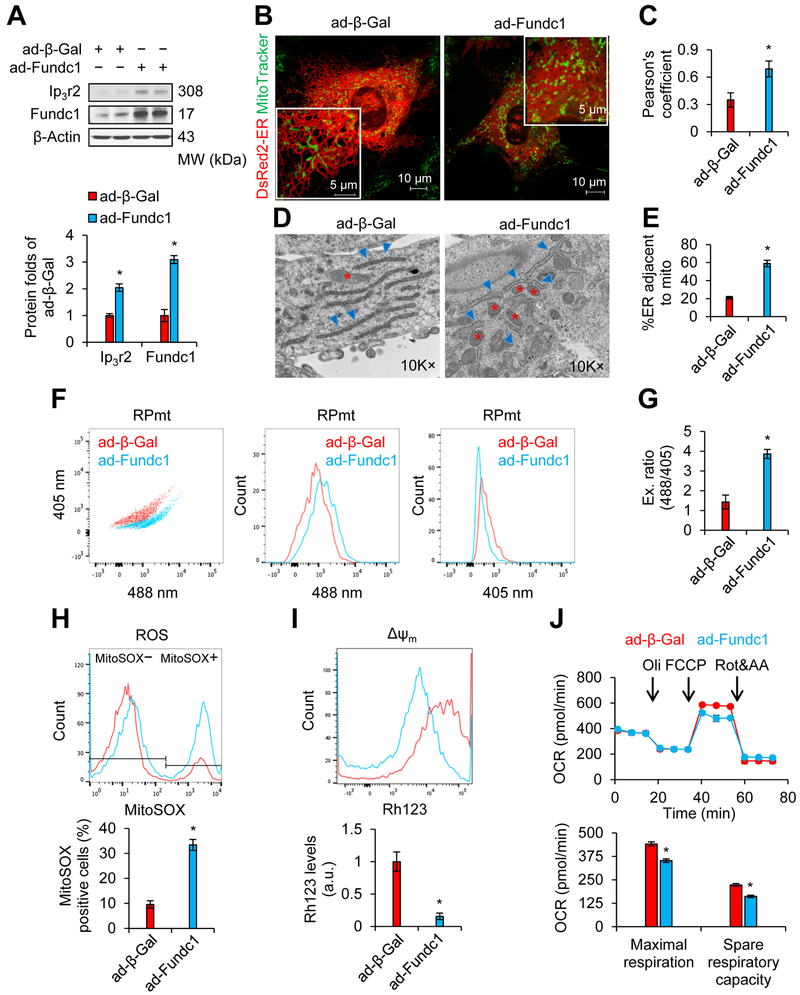
Figure 3. Adenovirus-mediated overexpression of FUN14 domain containing 1 (Fundc1) increases MAM formation and induces mitochondrial dysfunction in mouse neonatal cardiomyocytes.
Mouse neonatal cardiomyocytes (A-C; F-J) or H9c2 rat myoblasts (D and E) were infected with adenoviruses encoding Fundc1 (ad-Fundc1) or beta-galactosidase (ad-β-Gal) for 48 h. A, Proteins of interest were assayed by western blot. Densitometric analysis of the blots is shown in the lower panel (mean ± SD, *P < 0.05 versus ad-β-Gal). B, Confocal images illustrating the association between the ER (DsRed2-ER) and mitochondria (MitoTracker Green). Representative images are shown. C, Quantitation of ER-mitochondria contacts using the Pearson’s coefficient (mean ± SD, *P < 0.05 versus ad-β-Gal). D, Representative TEM images of ER and mitochondrial morphology are shown. The red stars indicate mitochondria, and the blue asterisks indicate ER. E, Quantitation of ER length adjacent to mitochondria, normalized to total ER length (mean ± SD, *P < 0.05 versus ad-β-Gal). F, FCM analysis illustrating mitochondrial Ca2+ levels using the RPmt indicator. Representative FCM plots are shown. G, The excitation ratio of 488/405 in each group (mean ± SD, *P < 0.05 versus ad-β-Gal). H, Representative FCM plots quantifying levels of reactive oxygen species (ROS) using the MitoSOX probe (upper panel) and histograms of the percentage of MitoSOX-positive cells in the indicated groups (lower panel) (mean ± SD, *P < 0.05 versus ad-β-Gal). I, Representative FCM plots illustrating mitochondrial membrane potential (ΔΨm) using the rhodamine 123 (Rh123) probe (upper panel). Intensities of Rh123-stained cells are quantified in the lower panel (mean ± SD, *P < 0.05 versus ad-β-Gal). J, Upper panel: Graph illustrating oxygen consumption rate (OCR), measured using a Seahorse extracellular flux analyzer. Lower panel: Quantitation of maximal respiration and spare respiratory capacity (mean ± SD, *P < 0.05 versus ad-β-Gal).

