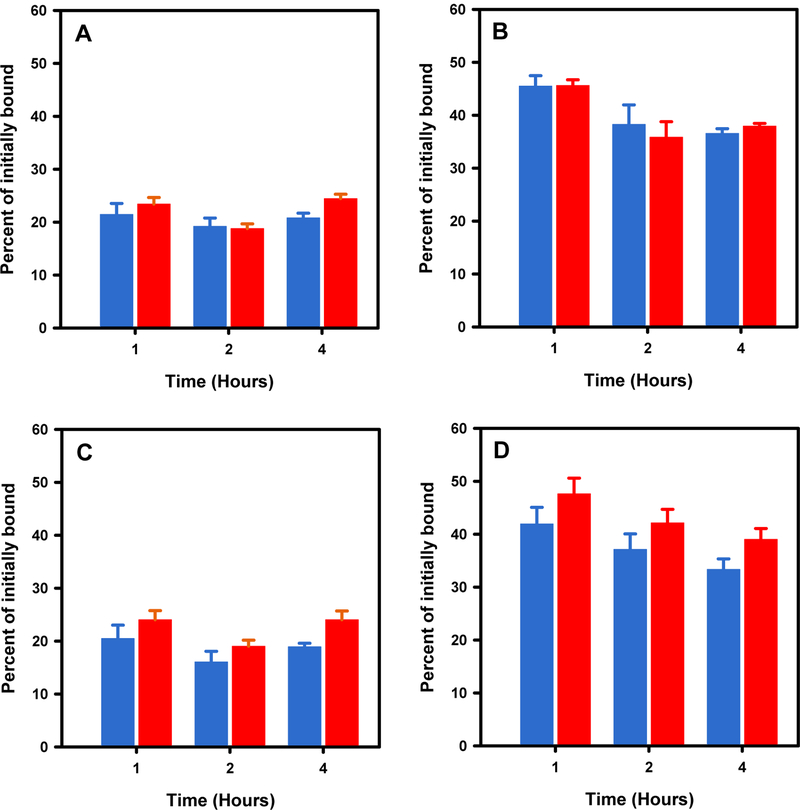
Figure 2.
Paired label internalization of [18F]TFPFN-2Rs15d (blue bars) and [125I]SGMIB-2Rs15d (red bars) on HER2-expressing SKOV-3 (A and B) and BT474M1 (C and D) cells. Internalized activity (A and C) and total cell-associated activity (B and D), both expressed as percentage of initially cell-bound activity, are shown.

