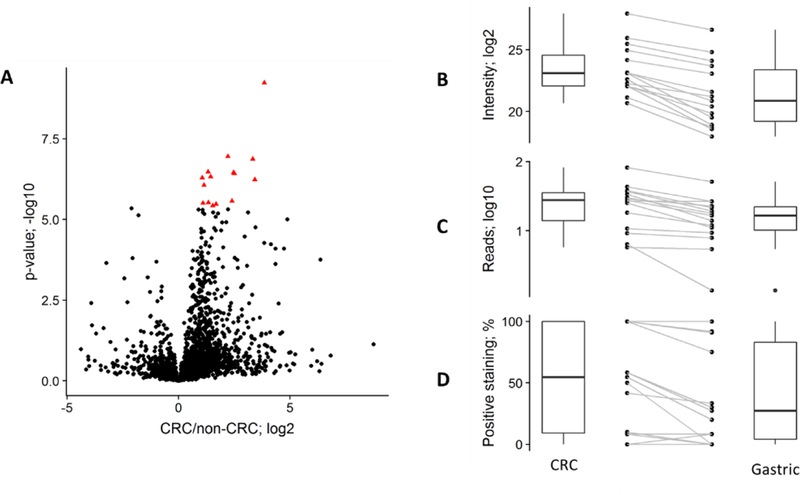
Figure 3.

Evaluation of DIA-based differential expression. (A) Volcano plot showing a Welch’s t-test on proteins identified with two or more peptides, comparing CRC (n=10) and non-CRC (n=2) samples. 15 proteins significantly overexpressed in the CRC samples (q-value <0.01; Bonferroni multiple-hypothesis testing correction; red triangles) were selected for further analysis. Boxplots and paired samples are shown for: our proteomic quantification (B; median intensity); median mRNA expression levels obtained in TCGA studies (C); and IHC-based tumor expression levels in the Human Protein Atlas (D).
