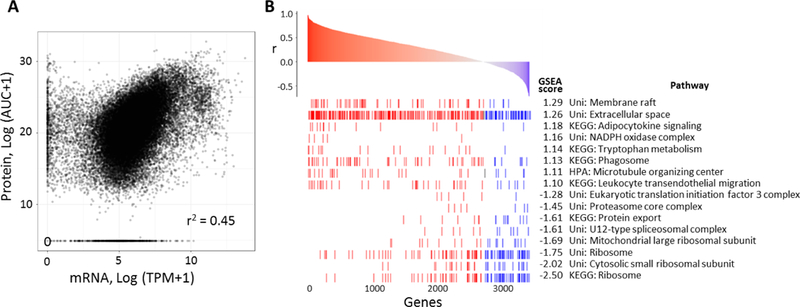
Figure 6.

Proteogenomic correlation analysis. (A) Overall correlation of protein and mRNA measurements across 3,429 protein-mRNA pairs from 12 patients (12 × 3,429 points). Spearman’s correlation coefficient is listed. (B) Gene set enrichment analysis of Spearman’s correlation coefficients between each protein-mRNA pair in 12 patients. 8 gene sets with the lowest FDR (<0.05) associated with either high protein-mRNA correlation (high GSEA score) or low protein-mRNA correlation are displayed.
