
4.
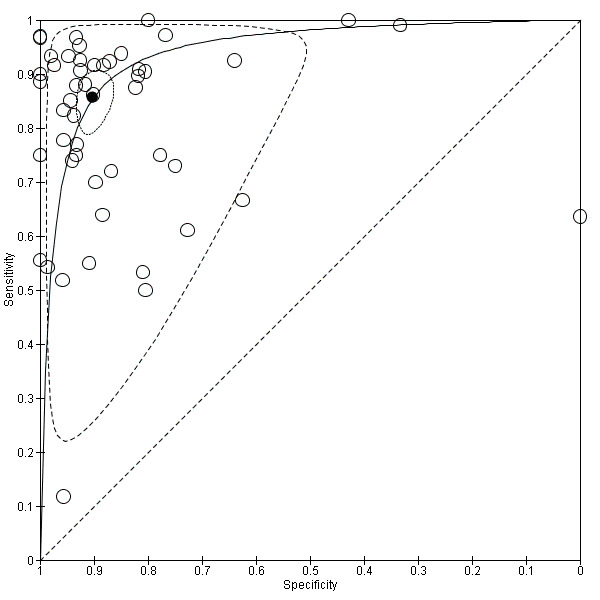
Summary ROC Plot of studies assessing the accuracy of EUS in discriminating T1 ‐ T2 versus T3 ‐ T4 gastric carcinomas. Each study sensitivity/specificity value is represented by an empty circle. The summary point for sensitivity/specificity is represented by a black filled circle. Dotted closed line: 95% confidence region of the summary point. Dashed closed line: 95% prediction region.