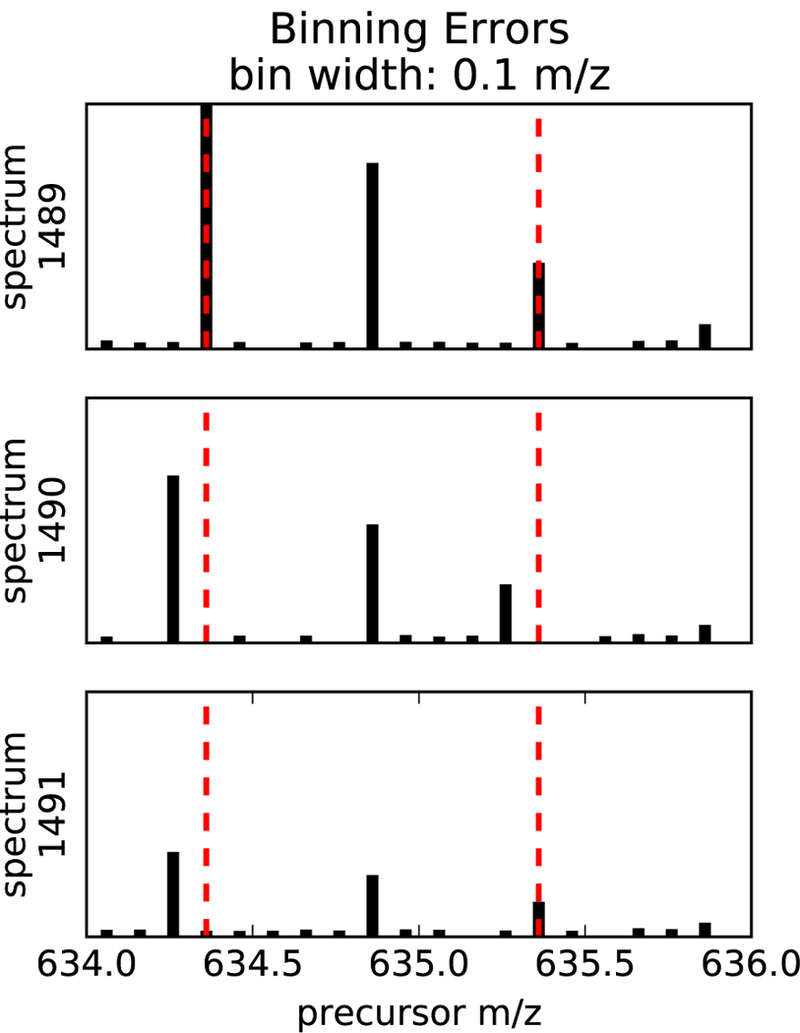
Figure 2: Binning errors introduced by small m/z bin size.

The figure shows excerpts of a sequence of three MS1 spectra over time, depicting the elution of a charge +2 isotope distribution whose peaks are binned at a 0.1 m/z bin width. The monoisotopic peak and the third isotopic peak each shift one bin to the left from scan 1489 to scan 1490.
