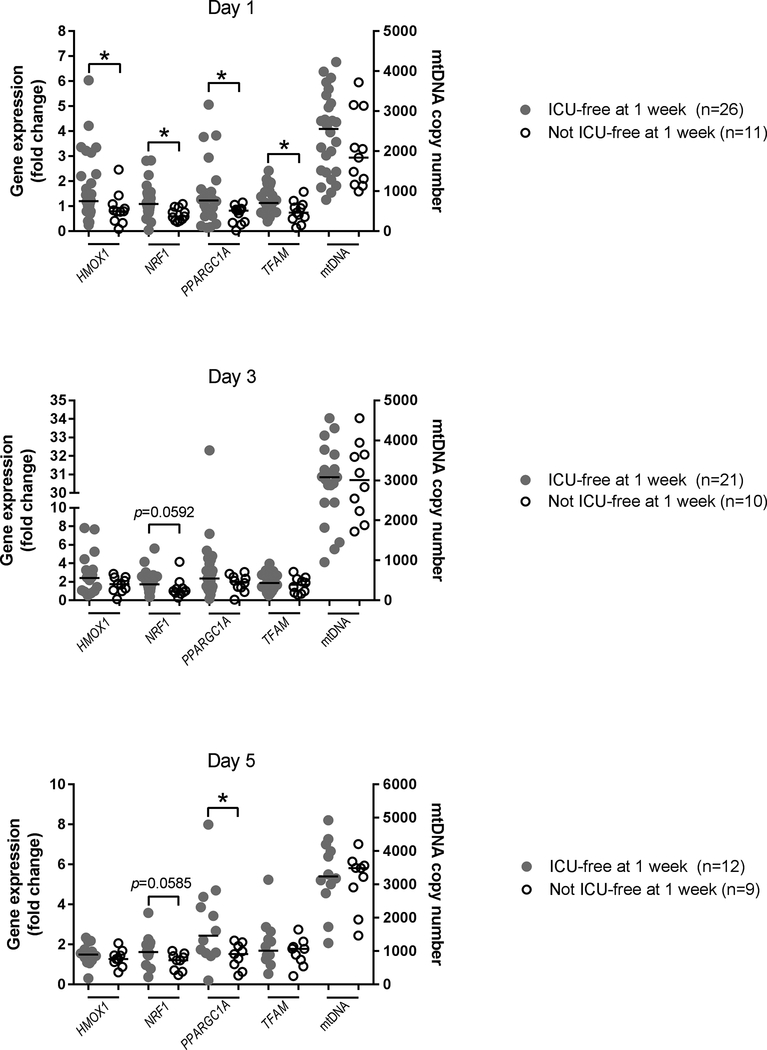
Figure 3.
Intensive care unit (ICU) freedom by 1 week as a function of PBMC gene expression on Days 1, 3, and 5. Closed grey circles depict individual subjects with sepsis that were discharged from the ICU within 1 week. Open black circles depict individual subjects with sepsis that had prolonged ICU stays (≥ 1 week) or early death (within 1 week of presentation). Left Y-axis shows gene expression (qRT-PCR) for HMOX1, NRF1, PPARGC1A, and TFAM. Right T-axis shows qRT-PCR of mtDNA copy number. Black horizontal bars depict median values. Statistical analysis is Mann-Whitney U test. *P<0.05 denotes statistically significant comparisons. Trends (P<0.1) are depicted on the graphs.

