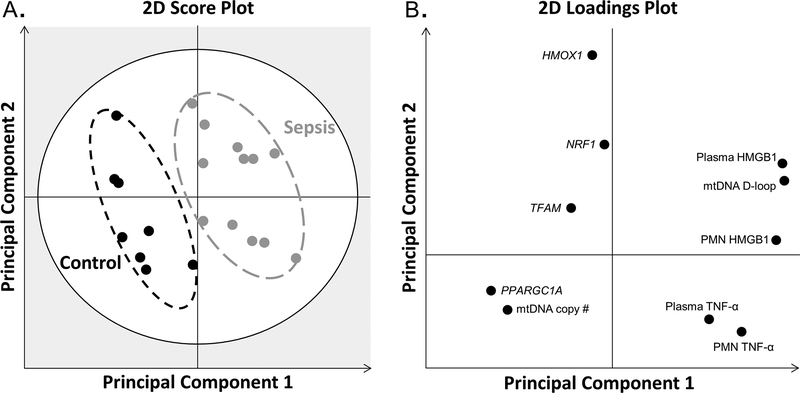
Figure 4.
Partial least-squares discriminant analysis. (A) 2D score plot shows the profiles of control (black circles) and septic (grey circles) subjects are distinct and separate. The grey zone in the score plot depicts outliers with 95% confidence. (B) The corresponding 2D loading plot depicts associations between clusters and the measured variables. The two principal components explain 85% of the variation of the model.

