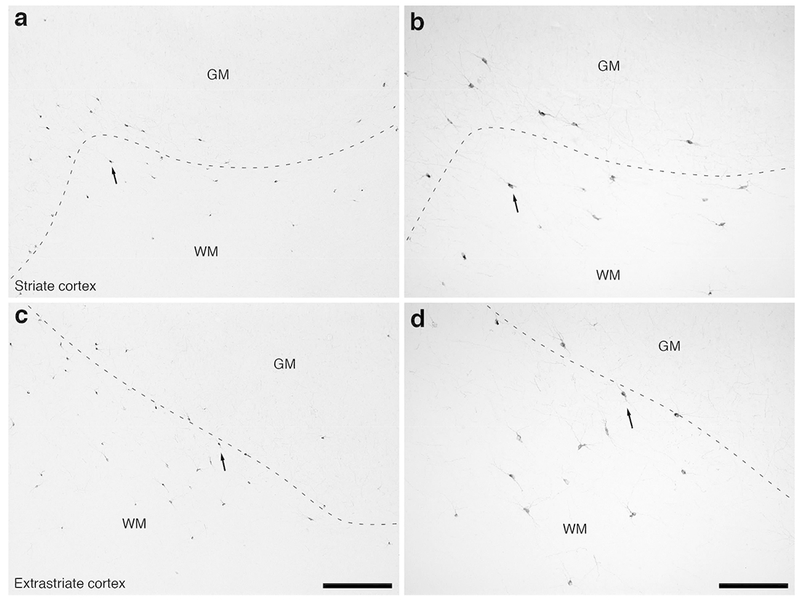
Figure 10:

Photomicrographs of nNOS immunostaining in the occipital lobe of the lar gibbon, showing the distribution of WMICs immunoreactive to nNOS. All conventions as in Fig. 7. (a) Moderately magnified image of the striate cortex, presumably primary visual cortex (from the region indicated by the b in Fig. 4a), showing the nNOS-immunoreactive WMICs. (b) High magnification image of the cortical/white matter boundary (marked by a dashed line) of the striate cortex, showing the nNOS-immunoreactive WMICs deep to the cerebral cortex. (c) Moderately magnified image of the extrastriate cortex, presumably secondary visual cortex (from the region indicated by the d in Fig. 4a), showing the numerous nNOS-immunoreactive WMICs. (d) High magnification image of the cortical/white matter boundary (marked by a dashed line) of the extrastriate cortex, showing the nNOS-immunoreactive WMICs. Scale bars in c = 500 μm and applies to a and c. Scale bar in d = 250 μm and applies to b and d. In all images dorsal is to the top of the image and medial to the left.
