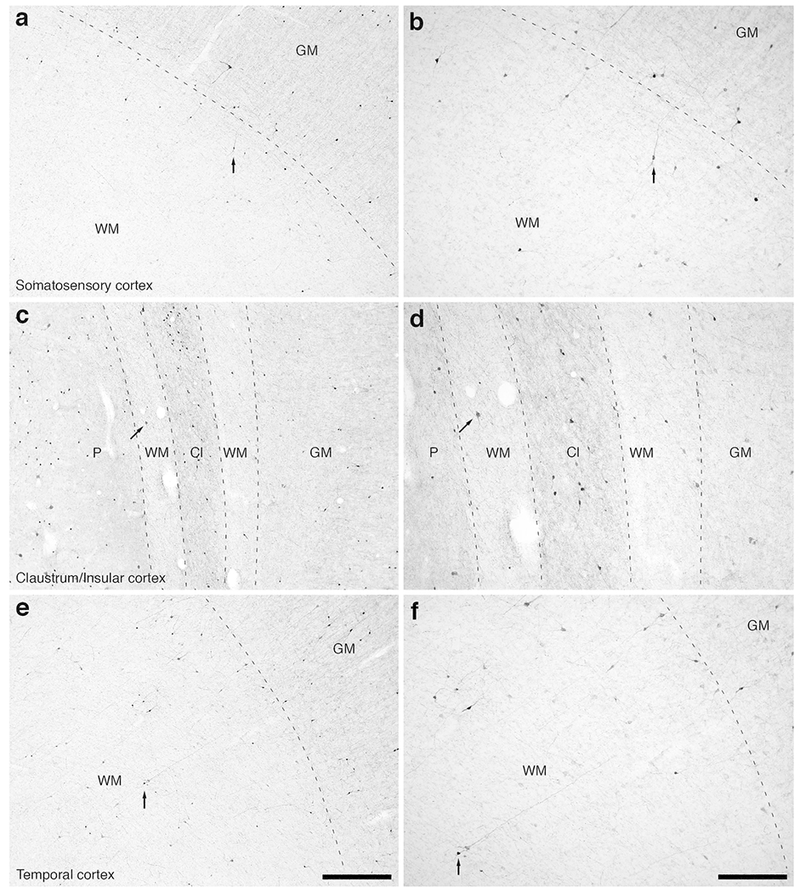
Figure 13:

Photomicrographs of CR immunostaining in the rostral portion of the parietal lobe, the claustrum/insular cortex and the temporal lobe of the lar gibbon, showing the distribution of WMICs immunoreactive to CR. (a) Moderately magnified image of the somatosensory cortex (from the region indicated by the b in Fig. 3a), showing the numerous CR-immunoreactive WMICs. (b) High magnification image of the cortical/white matter boundary (marked by a dashed line) of the somatosensory cortex, showing the CR-immunoreactive WMICs. (c) Moderately magnified image showing the putamen nucleus (P), claustrum (Cl) and insular cortex (GM), from the region indicated by the d in Fig. 3a, showing CR-immunoreactive WMICs within the deep WM. (d) High magnification image of the claustrum and surrounding white matter, showing the CR-immunoreactive WMICs in the deep WM. (e) Moderately magnified image of the temporal cortex (from the region indicated by the f in Fig. 3a), showing CR-immunoreactive WMICs. (f) High magnification image of the cortical/white matter boundary (marked by a dashed line) of the base of the temporal cortex, showing the CR-immunoreactive WMICs. Scale bar in e = 500 μm and applies to a, c and e. Scale bar in f= 250 μm and applies to b, d and f. In all images dorsal is to the top of the image and medial to the left.
