
Figure 5. Global changes by group and stimulation type.
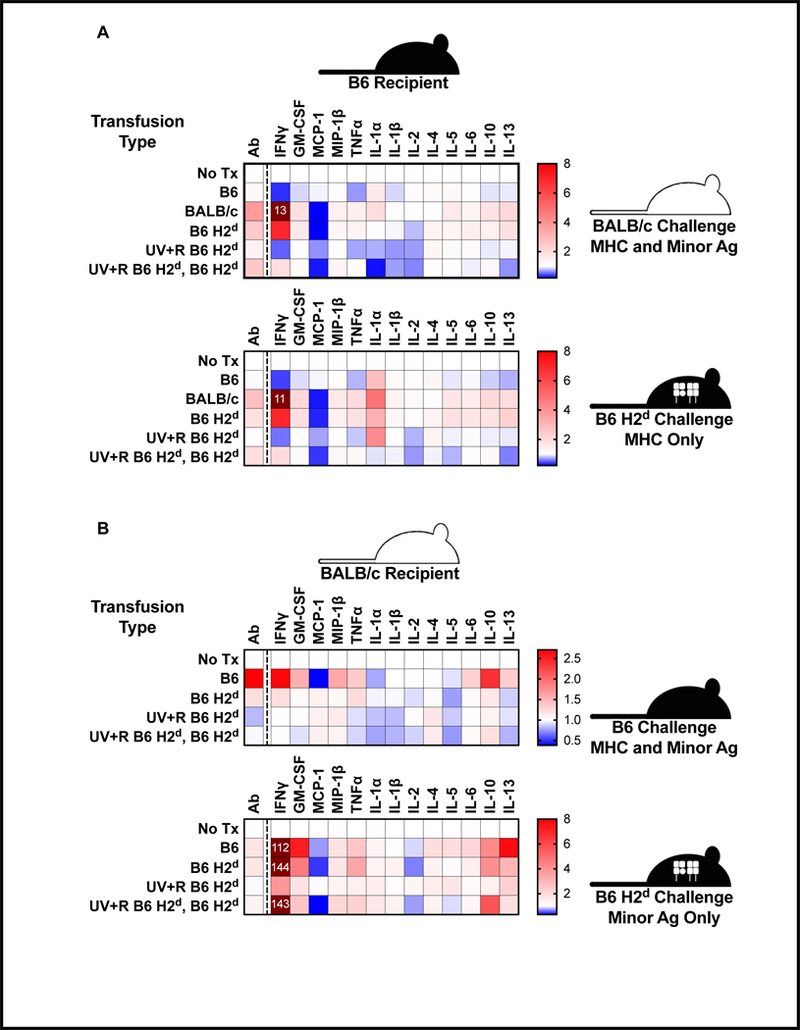
For each antibody or cytokine measurement, values for each animal were divided by the mean value for non-transfused controls, and the means of these fold changes values are plotted as heat maps. Values exceeding the upper limit of the map range labeled with fold-change values. (A) The experiments using B6 recipients are plotted for BALB/c target/stimulatory cells (allogeneic MHC and minor antigens) in the upper panel and B6 H2d target/stimulatory cells (allogeneic MHC only) in the lower panel. (B) The experiments using BALB/c recipients are plotted for B6 target/stimulatory cells (allogeneic MHC and minor antigens) in the upper panel and B6 H2d target/stimulatory cells (allogeneic minor antigens only) in the lower panel.