
Figure 6.
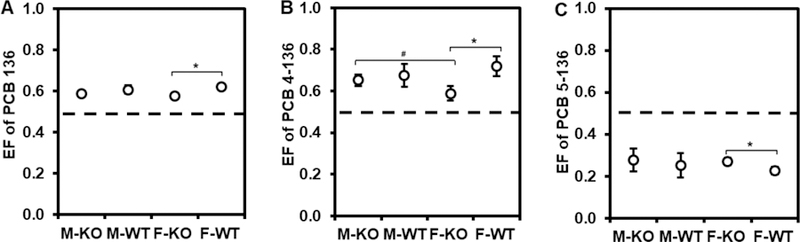
Comparison of enantiomeric fractions (EFs) of (a) PCB 136, (b) 4–136 and (c) 5–136 in whole blood from male and female KO and WT mice exposed to racemic PCB 136. Whole blood was collected 5 h after oral exposure to racemic PCB 136 (n = 3–6). Extracts were analyzed on CD (PCB 136 and 5–136) and CB (4–136) capillary columns as described under Experimental Procedures. EF values were calculated based on the equation EF = Area E2/(Area E1+Area E2) and are presented as the mean ± standard deviation. For a summary of the EF values, see Table S5. *: F-KO is significantly different from F-WT (p < 0.05), #: M-KO is significantly different from F-KO (p < 0.05). All EF values were significantly different from the EF values of the racemic PCB 136 (EF = 0.501 ± 0.003, n = 11), 4–136 (EF = 0.500 ± 0.003, n = 3) and 5–136 (EF = 0.500 ± 0.003, n = 3) standards.