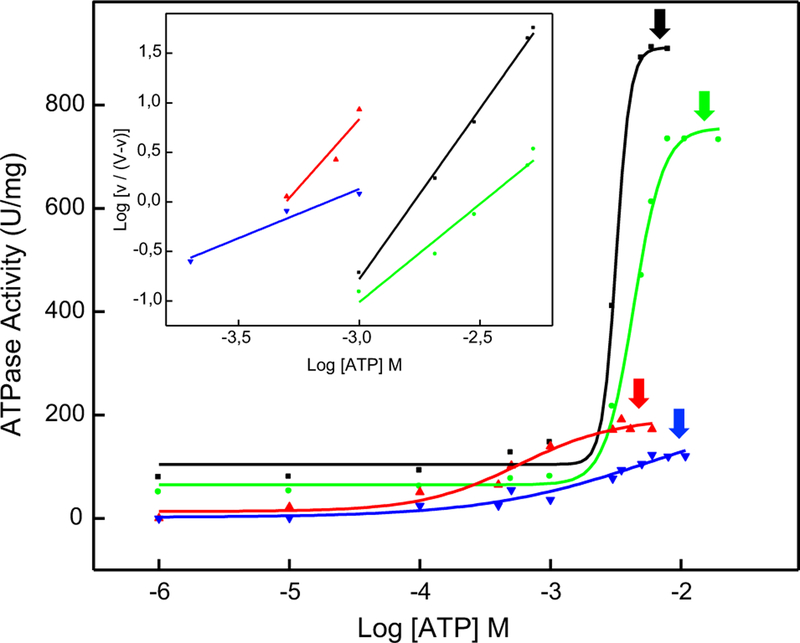
Fig. 1.
Achievement of Vmax for the hydrolysis of ATP by TNAP-proteoliposomes composed of different lipid compositions: (black) DPPC, (green) DPPC:Chol (9:1), (red) DPPC:SM (9:1) and (blue) DPPC:Chol:SM (8:1:1) (molar ratios). Arrows indicate the saturating ATP concentration for each distinct proteoliposome. Inset: representation to determine Hill coefficient (n). Data were reported as the mean of triplicate measurements of three different enzyme preparations

